
Fig. 1
- ID
- ZDB-FIG-160302-3
- Publication
- Hess et al., 2016 - Stable multilineage xenogeneic replacement of definitive hematopoiesis in adult zebrafish
- Other Figures
- All Figure Page
- Back to All Figure Page
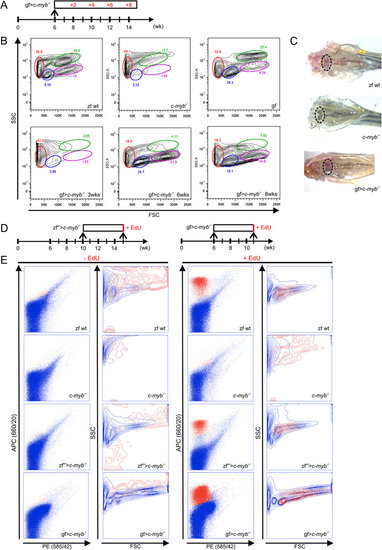
Reconstitution of hematopoiesis in adult c-mybI181N zebrafish mutants after transplantation of goldfish kidney marrow cells.(A) Schematic outline. A total of 23 transplantations were carried out and analyzed at various time points; representative data are shown for each time point. (B) Flow cytometric analysis of whole kidney marrow cell populations of adult fish of various genotypes and species (top panels) and after transplantation of goldfish marrow cells into mutant zebrafish (lower panels); the time points indicate time periods after transplantation. Wild type zebrafish (zf wt), c-myb mutant (c-myb-/-), goldfish (gf) and c-myb mutant transplanted with goldfish whole kidney marrow cells (gf > c-myb-/-). The different cell populations in zebrafish kidney are identified by their forward (size) and side (granularity) light scatter characteristics: red, erythrocytes; blue, lymphocytes; green, myelomonocytic cells; magenta, progenitor cells. (C) Macroscopic representation of kidney of wild type zebrafish (left), zebrafish mutants (middle), and zebrafish mutants reconstituted with goldfish hematopoietic cells (4 weeks after transplantation; right), all 10 weeks old. The locations of the head kidneys are indicated by ovals. (D) Schematic outline of proliferation assay. (E) Flow cytometric analysis of whole kidney marrow cells isolated from fish of the indicated genotypes pulse-labelled with EdU, creating a red-fluorescent signal in cells. No signal is observed in control mock-pulsed cells (two leftmost columns). Proliferating cells are detectable only in wild type zebrafish kidney marrow and in mutant zebrafish reconstituted with either zebrafish or goldfish cells, but not in unmanipulated zebrafish mutants (third column from the left). The light scatter characteristics of EdU-positive cells (red) are superimposed on EdU-negative cells (blue) (second and fourth columns from the left). Representative data of corresponding biological replicates are shown (zebrafish wild type, n = 7; c-myb-/-, n = 5; zf > c-myb-/-, n = 3; gf > c-myb-/-, n = 3). |