
|
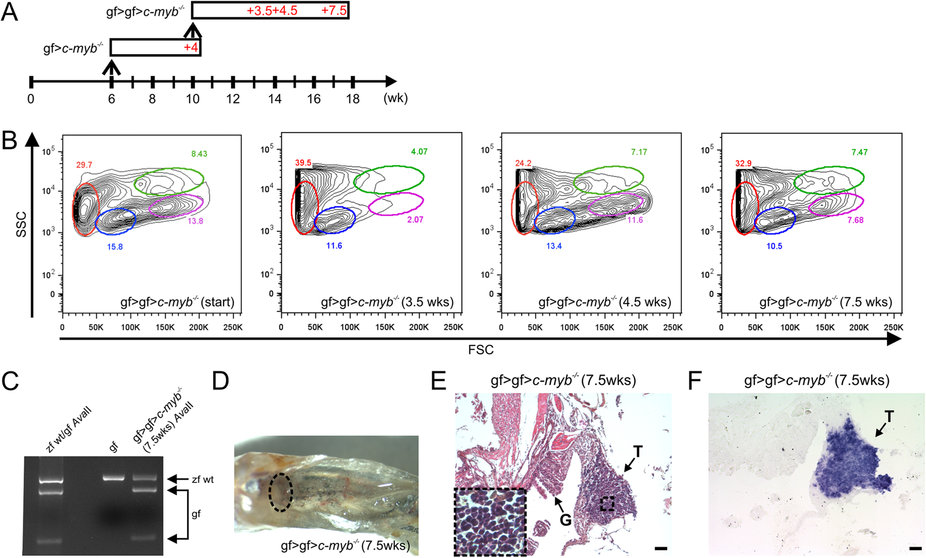
Fig. 3
Serial transplantation of goldfish hematopoietic progenitors.(A) Schematic of successive transplantation experiment. A total of 8 transplantations were carried out and analyzed at various time points; representative data are shown for each time point. The first transplantation (gf > c-myb-/-) was carried out when c-myb mutants had reached the age of 6 weeks; the secondary transplantation (gf > gf > c-myb-/-) was carried out 4 weeks later. (B) Flow cytometric analysis of whole kidney marrow cells. The profile of the cellular source material for secondary transplant is indicated on the left (gf > gf > c-myb-/- [start]); the other panels indicate the profiles for cells at various time points after the second transplantation. The different cell types are tentatively assigned (c.f. legend to Fig. 1). (C) Genotyping assay indicating the presence of goldfish cells in the whole kidney marrow derived from secondary transplantation. (D) Macroscopic view of kidney after secondary transplantation. The location of the head kidney is indicated by oval. (E) Colonization of the thymus (T) after secondary transplantation (haematoxylin/eosin staining); G, gills. (F) T cell development in the thymus (T) after secondary transplantation (RNA in situ hybridization with rag1 probe). Scale bars, 50 µm.