
- Title
-
Molecular Tattoo: Subcellular Confinement of Drug Effects
- Authors
- Képiró, M., Várkuti, B.H., Rauscher, A.A., Kellermayer, M.S., Varga, M., Málnási-Csizmadia, A.
- Source
- Full text @ Chem. Biol.

Molecular Tattooing Unveils the Autonomous Function of Non-muscle Myosin 2 in the Migration of pLLp of Live Zebrafish Embryos (A) Schematic drawings of zebrafish embryos displaying the spatial formation of the lateral line. (B) Fluorescence images of 48 hpf zebrafish embryos incubated in the absence and presence of ABleb in dark for 24 hr. White arrowheads mark the position of the halted pLLps. (C) Relative distance of pLLp migration in the presence of ABleb or NBleb (1 = distance from the otic vesicle to the tip of the tail). Dose-response curves were fitted to means ± SD (n = 4). (D) Relative fluorescence change of pLLps in live cldn:gfp zebrafish embryo during 2P irradiation in the presence of ABleb or NBleb. (E) Projected confocal z-stack images of zebrafish embryos with 2P-irradiated pLLps on one side (indicated by red arrows) in the presence of 1 µM ABleb, 1 µM NBleb, and non-irradiated embryo in the presence of 10 µM NBleb. White (non-irradiated) and red (irradiated) arrowheads mark sites of neuromast deposition. See also Movie S1. Scale bar represents 200 µm. |
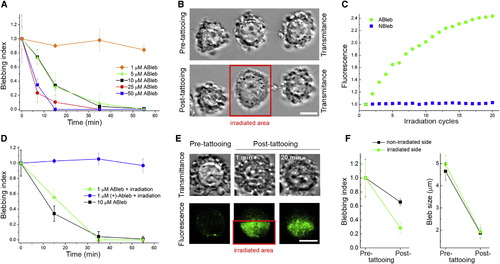
Cellular and Subcellular Targeting of Myosin 2 in Live M2 Cells Reveal Mechanistic Details of Myosin 2 Function in Blebbing (A) M2 cells were incubated at different concentrations of ABleb for 60 min in the dark and their blebbing indices were determined at the indicated times. (B) 2PM bright-field images of blebbing M2 cells in the presence of 1 µM ABleb before (pre-tattooing) and after (post-tattooing) 2P irradiating one of them (indicated by red square). See also Movies S2 and S3. Scale bar represents 10 µm. (C) Relative fluorescence of M2 cells during 2P irradiation cycles in the presence of 1 µM ABleb or NBleb. (D) Normalized blebbing indices of M2 cells in the presence of 1 µM ABleb or 1 µM (+)-ABleb following 2P irradiation and 10 µM ABleb without irradiation. (E) Fluorescence (lower panels) and bright-field (upper panels) images of an M2 cell before (pre-tattooing) and after 2P irradiation (post-tattooing) half of the cell (red square) in the presence of 1 µM ABleb. The diffusion of ABleb-myosin 2 covalent complexes was followed for 20 min. (F) Normalized blebbing indices (left panel) and bleb size (right panel) of irradiated and non-irradiated sides of hemi-tattooed M2 cells pre- and 20 min post-tattooing. Data represent means ± SD (n = 4). See also Movies S4 and S5. Scale bar represents 10 µm. |