
- Title
-
High-frequency dual mode pulsed wave Doppler imaging for monitoring the functional regeneration of adult zebrafish hearts
- Authors
- Kang, B.J., Park, J., Kim, J., Kim, H.H., Lee, C., Hwang, J.Y., Lien, C.L., Shung, K.K.
- Source
- Full text @ J. R. Soc. Interface
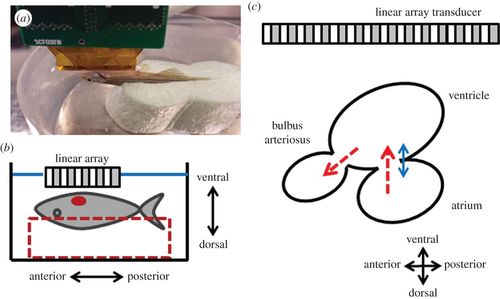
(a) The picture and (b) the diagram of the experimental set-up for zebrafish heart imaging. The adult zebrafish was sedated and placed on a chasm with the ventral side facing upwards and the ultrasound array was positioned above the heart. (c) Simplified schematic diagram of the zebrafish heart illustrates the atrium, ventricle and bulbus arteriosus. The red-dashed arrows indicate the direction of blood flow and the blue-solid arrow indicates the direction of tissue movement. |
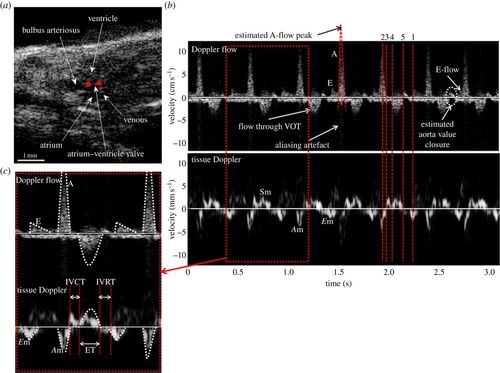
B-mode image and Doppler waveforms acquired with the dual mode PWD from a wild-type adult zebrafish before the heart amputation: (a) B-mode image of zebrafish heart in sagittal plane, (b) Doppler flow and tissue Doppler waveforms and (c) the magnified Doppler signals. The scales of the velocity are cm s1 and mm s1 for the Doppler flow and the TD signals, respectively. Red dots in (a) indicate the location of Doppler gates of the dual mode PWD. A-flow, E-flow and outflow in Doppler flow and the respective pairs of Am, Em and Sm in TD are identified at the same moments and indicated by red-dotted lines. The time duration between the red-dashed lines of ‘5’ and ‘1’ represents for IVRT, ‘3’ and ‘4’ for IVCT, and ‘4’ and ‘5’ is for ET. (Online version in colour.) |