
|
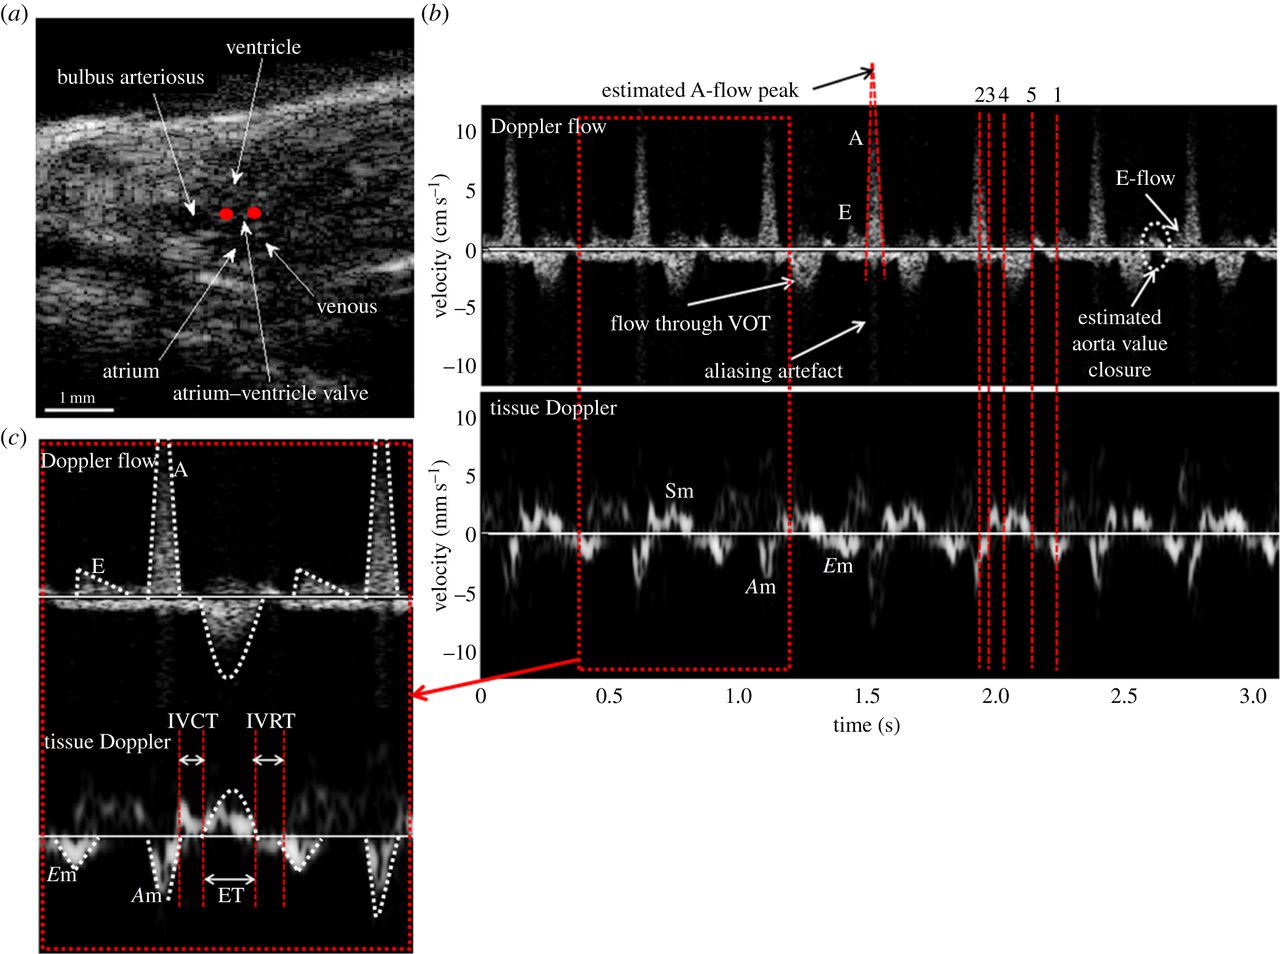
Fig. 7 B-mode image and Doppler waveforms acquired with the dual mode PWD from a wild-type adult zebrafish before the heart amputation: (a) B-mode image of zebrafish heart in sagittal plane, (b) Doppler flow and tissue Doppler waveforms and (c) the magnified Doppler signals. The scales of the velocity are cm s1 and mm s1 for the Doppler flow and the TD signals, respectively. Red dots in (a) indicate the location of Doppler gates of the dual mode PWD. A-flow, E-flow and outflow in Doppler flow and the respective pairs of Am, Em and Sm in TD are identified at the same moments and indicated by red-dotted lines. The time duration between the red-dashed lines of ‘5’ and ‘1’ represents for IVRT, ‘3’ and ‘4’ for IVCT, and ‘4’ and ‘5’ is for ET. (Online version in colour.)