
- Title
-
In vivo loss of function study reveals the short stature homeobox-containing (shox) gene plays indispensable roles in early embryonic growth and bone formation in zebrafish
- Authors
- Sawada, R., Kamei, H., Hakuno, F., Takahashi, S.I., Shimizu, T.
- Source
- Full text @ Dev. Dyn.
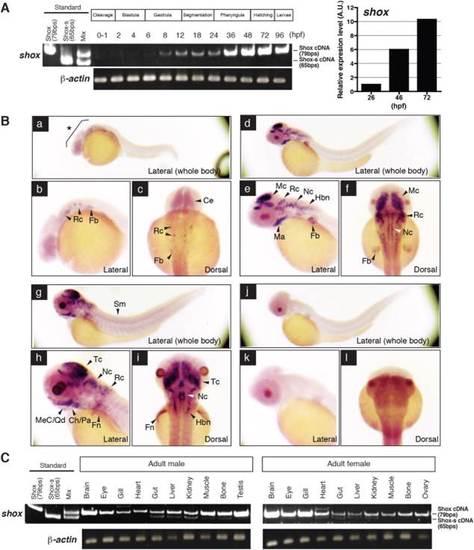
Temporal and spatial expression patterns of shox gene in developing embryo and in adult tissues. A: RT-PCR and qRT-PCR analyses results; hpf, hour post fertilization. B: In situ hybridization analysis of Shox mRNA. Fish of 24hpf stage (a, b, c), 48hpf stage (d–f and j–l), and 72hpf stage (g–i) are shown. a–i: Fish probed with the antisense riboprobe for Shox mRNA. j–l: Fish probed with sense riboprobe are shown. a, d, g, and j are lateral views with the head to the left, and, b, e, h, and k are corresponding magnified views of anterior region. c, f, I, and j represent dorsal view of the anterior region. Rc, Rhombencephalon; Fb, pectral fin-bud; Hbn, hindbrain neurons; Ce, cerebellum; Mc, mesencephalon; Nc, notochrd; Ma, mandibular arch; Tc, tectum; Pa, pharyngeal arch; Sm, somite muscle; MeC/Qd, Meckel′s cartilage/quadrate; Ch/Pa, ceratohyal/pharynx; Fn, pectral fin. *, modest signals at anterior region. C: Tissue distribution of Shox mRNA in adult fish. Three sexually matured male and female fish were sampled and the tissues were pooled and used for RT-PCR analysis. |
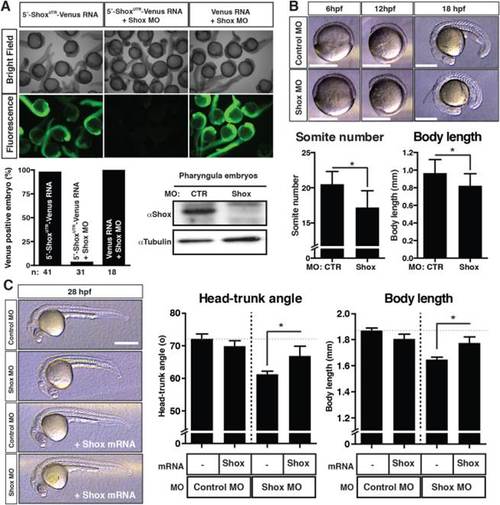
The effects of loss of Shox expression in developing embryo at the early pharyngula stage. A: Shox MO specificity in zebrafish embryo. The translation block Shox MO (8 ng/embryo) and in vitro synthesized capped Venus mRNA (250 pg/embryo) were co-injected at 1–2-cell-stage embryos, and the Venus signal was checked at 27hpf embryos. n: number of embryos assessed in the analysis. Immunoblot analysis of endogenous Shox and tubulin proteins are shown. B: The phenotypes of Shox MO-injected morphant embryos at gastrula-segmentation stages. Bars = 0.5 mm. The somite numbers and body length at 18hpf embryos are shown. Values are represented as mean±S.D. (n=18–20). Asterisk (*) represents statistical significance (P<0.05). C: Embryonic growth at the pharyngula stages. Either control MO or Shox MO (8 ng/embryo), or a combination of MO and the MO-resistant Flag-Shox mRNA (500 pg/embryo) was injected into 1–2-cell-stage embryos. The embryos were raised to 28hpf and the head-trunk angle and body length were measured. Representative embryos are displayed in the left panels. Bars = 0.5 mm. Values are represented as mean±S.D. (n=13–28). Asterisk (*) represents statistical significance (P<0.05). PHENOTYPE:
|
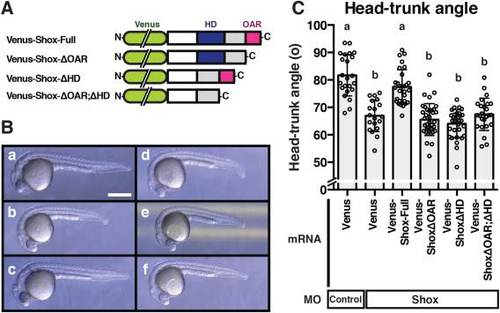
The in vivo functional characterization of Shox. A: Illustrations of varieties of deletion mutants of Shox. The synthesized N-term Venus fusion Shox mRNAs were all Shox MO resistant. The capped mRNAs (750 pg/embryo) were co-injected with Shox MO (8 ng/embryo). B: Representative embryos are displayed in a–f. Bar = 0.5 mm. a: Control MO and Venus mRNA; b: Shox MO and Venus mRNA; c: Shox MO and Venus-Shox-full mRNA; d: Shox MO and Venus-ShoxΔOAR mRNA; e: Shox MO and Venus-ShoxΔHD; f: Shox MO and Venus-ShoxΔOAR;ΔHD. C: The head-trunk angle of injected embryos at 26hpf stage. Values are represented as mean±S.D. (n=19–36). Groups with different letters are significantly different from each other (P< 0.05). |
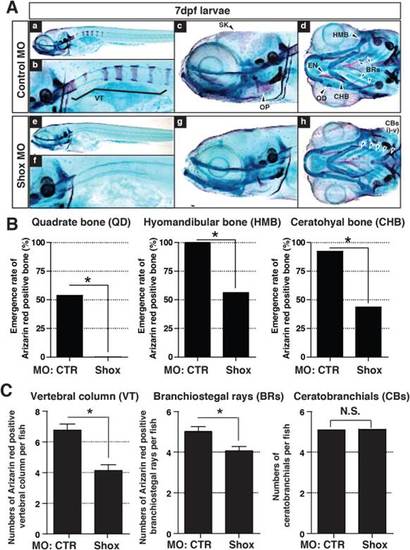
The effects of early developmental loss of the shox gene expression on the calcification process in multiple craniofacial bones and vertebral columns. A: Results of the Alizarin red/Alcian blue staining in 7dpf larvae. a–d: Fish injected with control MO (8 ng/embryo). e–h: Fish injected with the same dose of the Shox MO at the 1–2-cell-stage embryos. a and e show whole body from lateral view, and b and f are magnified views of anterior vertebral columns. c, d, g, and h are magnified views of head region. c and g represent the lateral view, and d and h are the ventral view. VT, vertebral columns; SK, skull; OP, opercle; EN, entopterygoid; QD, quadrate; CHB, ceratohyal bone; BRs, branchiostegal rays; HMB, hyomandibular bone; CBs, ceratobranchials. B: Emergence rate of the Alizarin red positive bones (QD, CHB, and HMB) in 7bpf larvae. C: Cumulative numbers of Alizarin red positive VT and BRs (mineralized bone) and the numbers of CBs (cartilage) in the 10dpf larvae. Values are represented as mean±S.D. (n=13–16). PHENOTYPE:
|