
|
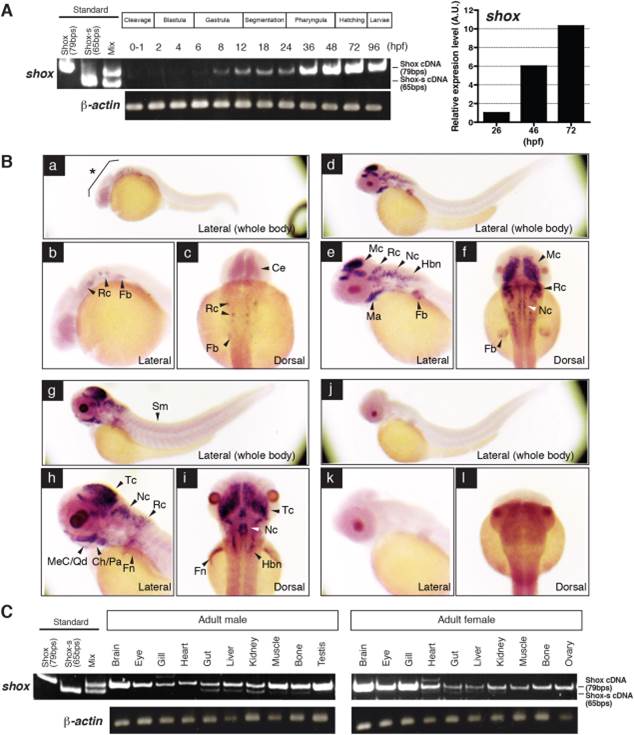
Fig. 2
Temporal and spatial expression patterns of shox gene in developing embryo and in adult tissues. A: RT-PCR and qRT-PCR analyses results; hpf, hour post fertilization. B: In situ hybridization analysis of Shox mRNA. Fish of 24hpf stage (a, b, c), 48hpf stage (d–f and j–l), and 72hpf stage (g–i) are shown. a–i: Fish probed with the antisense riboprobe for Shox mRNA. j–l: Fish probed with sense riboprobe are shown. a, d, g, and j are lateral views with the head to the left, and, b, e, h, and k are corresponding magnified views of anterior region. c, f, I, and j represent dorsal view of the anterior region. Rc, Rhombencephalon; Fb, pectral fin-bud; Hbn, hindbrain neurons; Ce, cerebellum; Mc, mesencephalon; Nc, notochrd; Ma, mandibular arch; Tc, tectum; Pa, pharyngeal arch; Sm, somite muscle; MeC/Qd, Meckel′s cartilage/quadrate; Ch/Pa, ceratohyal/pharynx; Fn, pectral fin. *, modest signals at anterior region. C: Tissue distribution of Shox mRNA in adult fish. Three sexually matured male and female fish were sampled and the tissues were pooled and used for RT-PCR analysis.