
- Title
-
A Novel Zebrafish Model to Provide Mechanistic Insights into the Inflammatory Events in Carrageenan-Induced Abdominal Edema
- Authors
- Huang, S.Y., Feng, C.W., Hung, H.C., Chakraborty, C., Chen, C.H., Chen, W.F., Jean, Y.H., Wang, H.M., Sung, C.S., Sun, Y.M., Wu, C.Y., Liu, W., Hsiao, C.D., Wen, Z.H.
- Source
- Full text @ PLoS One
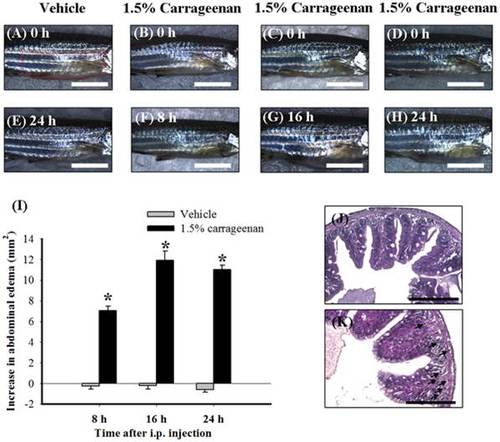
The time course for the abdominal-edematous effects of i.p. carrageenan (1.5%) in adult zebrafish. The photographic images show the gross pathology of the abdomen in the lateral view following i.p. injection of vehicle (PBS) plus i.p. injection vehicle (PBS) (A and E) and i.p. injection vehicle plus i.p. injection of 1.5% carrageenan at each time point (B–D and F–H). Images A–D were taken at 0 h after i.p. injection of vehicle or 1.5% carrageenan; images E, F, G, and H were taken at 24 h after i.p. injection of vehicle and 8, 16, and 24 h after 1.5% carrageenan injection. Scale bars: 5 mm for images A–H. The increase of the lateral area of the abdomen was given as a difference change from the basal values by subtracting the basal lateral area from the lateral area measured at each time point. Time course of change of the lateral area of abdomen induced by i.p. injection of vehicle (PBS) or carrageenan in adult zebrafish using a photographic image analysis system (I). Compared with the i.p. vehicle groups, the lateral area of abdomen increased progressively in the i.p. 1.5% carrageenan groups until 24 h. Sections (2 µm) of zebrafish abdominal tissues at 24 h after an i.p. injection of vehicle (J) or carrageenan (K). I.p. carrageenan dramatically induced leukocyte infiltration (arrows) in the intestine. Scale bars: 100 µm for images (J) and (K). Each bar in Figure (I) represents the mean ± SEM of 9 adult zebrafish per group. *P<0.05 compared with the same time points in the i.p. vehicle (PBS) group. |
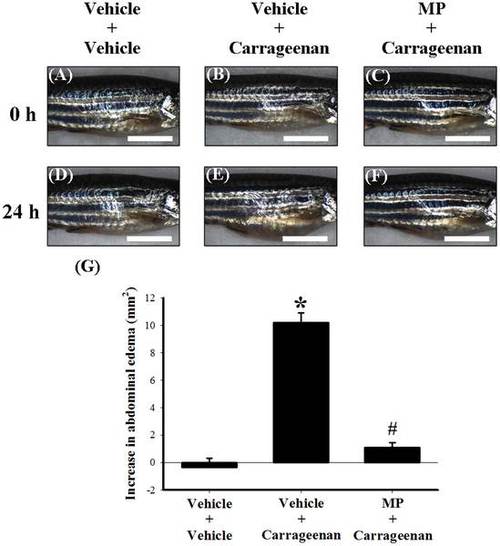
The anti-edematous effects of i.p. MP in carrageenan-injected adult zebrafish. The photographic images show the gross pathology of the abdomen in the lateral view from the i.p. injection vehicle (PBS) plus i.p. injection vehicle group (A and D), the i.p. injection vehicle plus i.p. injection 1.5% carrageenan group (B and E), and the i.p. injection MP plus i.p. 1.5% carrageenan group (C and F). Images A–C were taken at 0 h after the second injection (as well as 1 h after the first injection); images D–F were taken at 24 h after the second injection (as well as 25 h after the first vehicle or MP injection). Scale bars: 5 mm (for all images). Quantification of the lateral area of abdomen induced by i.p. injection of vehicle or carrageenan in adult zebrafish using a photographic image analysis system (G). We used 1 µg MP as a positive control. MP administered by i.p. injection 1 h before carrageenan injection significantly inhibited carrageenan-induced abdominal edema. Each bar in Figure G represents the mean ± SEM of 9 adult zebrafish per group. MP: methylprednisolone. *P<0.05 compared with the i.p. vehicle plus i.p. vehicle group; #P<0.05 compared with the i.p. vehicle plus i.p. 1.5% carrageenan group. |
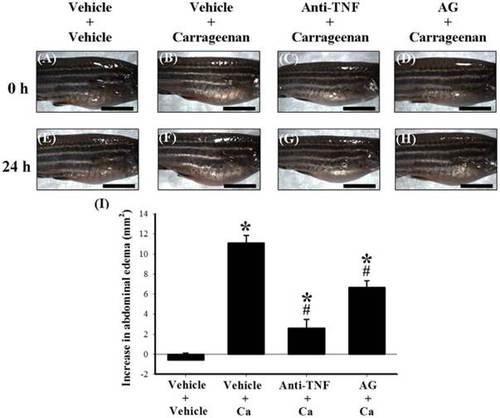
The anti-edematous effects of i.p. anti-TNF-α antibody and AG in carrageenan-injected adult zebrafish. The photographic images show the gross pathology of the abdomen in the lateral view in the i.p. vehicle (PBS) plus i.p. vehicle group (A and E), the i.p. vehicle plus i.p. 1.5% carrageenan group (B and F), the i.p. anti-TNF-α antibody (1:5 dilution in a volume of 20 µL) plus i.p. 1.5% carrageenan group (C and G), and the i.p. AG (1 µg) plus i.p. 1.5% carrageenan group (D and H). Images A–D were taken at 0 h after the second injection of vehicle or carrageenan (as well as 1 h after the first injection of vehicle, anti-TNF-α antibody, or AG); images E–H were taken at 24 h after the second injection of vehicle or carrageenan (as well as 25 h after the first injection of vehicle, anti-TNF-α antibody, or AG injection). Scale bars: 5 mm for all images. Quantification of the lateral area of the abdomen induced by the second injection of vehicle or carrageenan in adult zebrafish using a photographic image analysis system (I). Anti-TNF-α antibody or AG administered 1 h before carrageenan injection markedly reduced carrageenan-induced abdominal edema. Each bar in Figure (I) represents the mean ± SEM of 9 adult zebrafish per group. anti-TNF: anti-TNF-α antibody; AG: aminoguanidine; Ca: carrageenan; *P<0.05 compared with the i.p. injection of vehicle plus i.p. vehicle group; #P<0.05 compared with the i.p. vehicle plus i.p. 1.5% carrageenan group. |
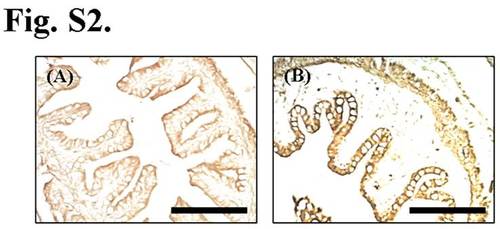
Upregulatory effect of carrageenan on iNOS protein expression in abdominal tissues of zebrafish. For immunohistochemistry, after deparaffinization in xylene and rehydration with a graded series of ethanol, endogenous peroxidase activity of the abdominal sections was quenched using 0.3% H2O2 for 30 min. Then, the sections were permeabilized with 0.1% Triton X-100 in PBS for 20 min. Following retrieval of the antigen with proteinase K (20 mM; Sigma) in PBS for 20 min, to decrease nonspecific adsorption we incubated the sections using 5% normal goat serum in PBS for 30 min. The sections were incubated overnight at 4°C with anti-iNOS (1:100 dilution; BD Pharmingen, San Diego, CA, USA; catalog no. 610332) antibody. Finally, after incubation with biotin-conjugated anti-rabbit IgG (1:200 dilution; Vector Laboratories Inc, Burlingame, CA, USA; catalog no. BA-1100) for 30 min followed by avidin-biotin-peroxidase complex for 30 min (Vectastain ABC kit; Vector Laboratories Inc, Burlingame, CA, USA; catalog no. PK-6100), the sections were incubated with 3,32-diaminobenzidine tetrahydrochloride (DAB) (Vectastain ABC kit; Vector Laboratories Inc, Burlingame, CA, USA; catalog no. SK-4100) for 8 min. We analyzed the all stained sections using a Leica DM-6000 CS microscope (Leica Instruments Inc., Wetzlar, Germany) and a microscope digital camera system (SPOT Idea 5 MP CMOS scientific color digital camera system, Diagnostic Instruments, Inc., Sterling Heights, MI, USA). The sections (2 µm) at 24 h after an i.p. injection of vehicle (A) or carrageenan (B). I.p. carrageenan obviously increased iNOS immunoreactivity of the intestine. Scale bars: 100 µm for all images. |