
- Title
-
R-Spondin 3 Regulates Dorsoventral and Anteroposterior Patterning by Antagonizing Wnt/β-Catenin Signaling in Zebrafish Embryos
- Authors
- Rong, X., Chen, C., Zhou, P., Zhou, Y., Li, Y., Lu, L., Liu, Y., Zhou, J., Duan, C.
- Source
- Full text @ PLoS One

The spatiotemporal expression pattern of zebrafish rspo3. (A) RT-PCR analysis of zebrafish rspo3 mRNA at the indicated embryonic stages. Numbers indicate different developmental stages as hours post fertilization (hpf). β-actin as internal control. -, negative control; +, positive control. (B) Whole-mount in situ hybridization analysis of zebrafish rpso3 mRNA at the indicated stages. All panels are dorsal, top, or lateral views with animal pole up or anterior to the left. Scale bars = 200 μm. |

Effects of rspo3 overexpression and knockdown in zebrafish embryos. (A) Classification of phenotypes caused by forced expression of rspo3. One-cell stage embryos were injected with 600 pg rspo3 mRNA. Embryos were raised to 24 hpf and examined. Lateral views with anterior to the left. Scale bar = 200 μm. (B) The percentages of embryos in each category as shown in (A). The results are from three independent experiments and the total embryo numbers are given at the top. (C, D) Expression patterns of the indicated marker genes in wild-type (WT) embryos or embryos injected with 600 pg gfp mRNA or rspo3 mRNA. Embryos were analyzed at 24 hpf by in situ hybridization. Lateral view with anterior to the left (C) and dorsal view with anterior up (D) are shown, and the frequency of embryos with the indicated patterns is shown in the bottom right in each panel. Double arrow lines in C show the distance from the telencephalon to the yolk. Blank arrow heads in D indicate the heart labeled by nkx2.5 mRNA. (E) Effectiveness and specificity of MOs used. Fluorescent micrographs of zebrafish embryos at 12 hpf injected with the rspo3 52-UTR reporter plasmid alone (100 pg), the reporter plasmid DNA with control MO (4 ng), rspo3 targeting MO1 (4 ng) or rspo3 targeting MO2 (8 ng), respectively. (F) Classifications of phenotypes caused by morpholino-mediated knockdown of rspo3. Representative views of zebrafish embryos at 24 hpf injected with 8 ng control MO (cMO), 4 ng (MO1) or 8 ng (MO2) rspo3 targeting MO, and 4 ng MO1 or 8 ng MO2 plus 20 pg rspo3 mRNA (MO+rspo3). Lateral views with anterior to the left. The amplified head region of each embryo is shown in right corner insert. Scale bar = 200 μm. (G) The percentages of embryos in each category as shown in (F). The results are from three independent experiments and the total embryo numbers are given at the top. ### P<0.0001, Chi-Square test. (H) Expression patterns of the indicated marker genes in embryos injected with 8 ng cMO, 4 ng rspo3 MO1, or 8 ng MO2. Embryos were analyzed at 14 hpf by in situ hybridization. Dorsal view with anterior to the top is shown, and the frequency of embryos with the indicated patterns is shown in the bottom left corner of each panel. The blank dash lines show the extension of the marker expression. Scale bar = 200 μm. Next, knockdown experiments were carried out using two independent translation- blocking antisense MOs. The efficacy of these rspo3 targeting MOs was verified by co-injecting an rspo3 52-UTR-GFP expression construct. Both MO1 and MO2 blocked the reporter GFP expression (Fig. 3E). Knockdown of rspo3 by either MO1 or MO2 resulted in an increase in the number of embryos displaying enhanced ventral-posterior phenotypes (Fig. 3F and 3G). In addition, knockdown of rspo3 resulted in lateral expansion of somites as indicated by myoD mRNA expression at 14 hpf (Fig. 3H). The abnormal embryos were classified into medium and severe groups (Fig. 3F and 3G). Embryos in the medium group exhibited smaller eyes, slightly reduced head, and curved body axis (Fig. 3F). Embryos in the severe group exhibited smaller eyes, reduced brain, and shorter and curved body axis (Fig. 3F). 50% and 42% of the MO1-injected embryos were in the severe and medium group (Fig. 3G). Likewise, 40% and 38% of the MO2-injected embryos were in the severe and medium group (Fig. 3G). Importantly, co-injection of rspo3 mRNA with MO1 or MO2 markedly reduced the MO-induced abnormal phenotypes from ~90% to ~40% (MO1) and ~80% to ~25% (MO2), respectively (p<0.0001) (Fig. 3G). EXPRESSION / LABELING:
PHENOTYPE:
|
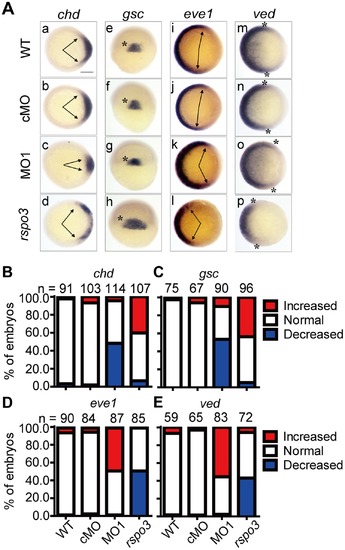
Zebrafish Rspo3 regulates dorsoventral patterning. (A) Expression patterns of the indicated marker genes in wild-type (WT) embryos or embryos injected with 4 ng control MO (cMO), 4 ng rspo3 targeting MO1 or 600 pg rspo3 mRNA, respectively. Embryos were analyzed at the shield stage by in situ hybridization using the indicated probes. Panels a–d and i-p are top views with animal pole up and dorsal to the right; panels e–h are lateral and dorsal views with animal pole up. Arrows indicate the width of the expression domains; asterisks indicate the edges of the expression domains. Percentages of embryos in each category were calculated and are shown in B (chd), C (gsc), D (eve1) and E (ved). The total embryo numbers from three independent experiments are shown on the top of each bar. Scale bar = 200 μm. EXPRESSION / LABELING:
|
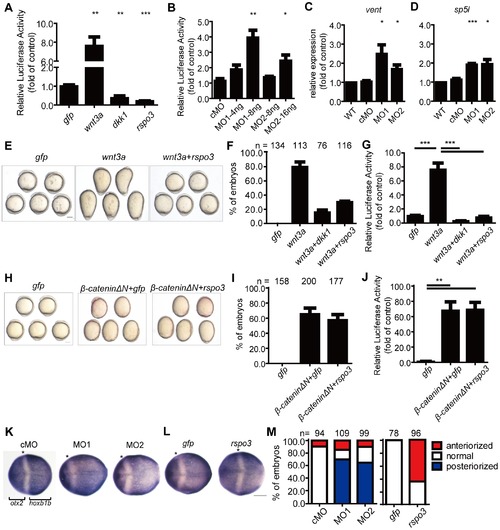
Rspo3 inhibits the zygotic Wnt/β-catenin signaling in zebrafish embryos. (A) Rspo3 inhibited Wnt/β-catenin reporter activities. One-cell stage embryos were injected with Topflash reporter DNA together with 600 pg gfp mRNA, 20 pg wnt3a mRNA, 200 pg dkk1 mRNA, or 600 pg rspo3 mRNA, respectively. Injected embryos were raised to the shield stage and the luciferase activity was measured. Values are means ± S.E. (n = 3). **, ***P<0.01 and 0.001 vs. the gfp group. (B) Knockdown of rspo3 increased Wnt/β-catenin reporter activity. One-cell stage embryos were injected Topflash reporter DNA together with cMO (16 ng), MO1, or MO2, respectively. Injected embryos were raised to the shield stage and the luciferase activity was measured. (C and D) Knockdown of rspo3 increased the expression levels of vent (C) and sp5l (D) mRNA. Embryos were injected with cMO (8 ng), MO1 (4 ng) or MO2 (8 ng) at the one-cell stage, and wild-type embryos were used as control. The vent and sp5l mRNA levels were measured by RT-qPCR at the 90% epiboly stage. Values are means ± S.E. (n = 3). *, **, ***P<0.05, 0.01, and 0.001 vs. the cMO group. (E) Rspo3 inhibited Wnt3a activity. Representative views of embryos. The pictures were taken at the 5-somite stage. (F) Quantitative results. The percentages of dorsalized embryos described in (E) were calculated and shown. The total embryo numbers are given at the top. Embryos were injected with 600 pg gfp mRNA, 20 pg wnt3a mRNA, 20 pg wnt3a mRNA plus 200 pg dkk1, or 600 pg rspo3 mRNA. (G) Rspo3 inhibited Wnt3a-stimulated Topflash reporter activity. One-cell stage embryos were injected with Topflash DNA together with the indicated mRNA, the injected embryos were raised to the shield stage and luciferase activities were determined. Values are means ± S.E. (n = 3). ***P<0.0001, one-way ANOVA test. (H) Rspo3 cannot inhibit β-cateninΔN activity. Representative views of embryos injected with 600 pg gfp mRNA, 50 pg β-cateninΔN mRNA, or 50 pg β-cateninΔN plus 600 pg rspo3 mRNA. The pictures were taken at the 5-somite stage. (I, J) Quantitative results (I) and luciferase activity assay (J). Values are means ± S.E. (n = 3). **P<0.01, one-way ANOVA test. (K) Knockdown of rspo3 decreased the expression of otx2 and increased the expression of hoxb1b at the 100% epiboly stage. (L) Overexpression of rspo3 increased the expression of otx2 and decreased the expression of hoxb1b at the 100% epiboly stage. Dorsal views with anterior to the left are shown. Asterisks indicate the edges of the expression domains (K, L). Scale bars = 200 μm. (M) The percentage of embryos were calculated and shown. The results are from three independent experiments, and the total embryo numbers are given at the top. EXPRESSION / LABELING:
|

Effects of forced expression of human RSPO3 in zebrafish embryos. (A) The phenotypes of embryos injected with 600 pg gfp or RSPO3 mRNA were scored and presented following the criteria described in Fig. 3A. The results are from three independent experiments and the total embryo numbers are given at the top. (B–F) Human RSPO3 alters the expression of the indicated genes in zebrafish embryos. Embryos injected with 600 pg RSPO3 or gfp mRNA were analyzed by whole mount in situ hybridization at the shield stage using the indicated probes. Scale bar = 200 μm. Percentages of embryos in each category were calculated and shown in C (chd), D (gsc), E (eve1), and F (ved). The total embryo numbers from three independent experiments are shown on the top of each bar. |