
- Title
-
Grouper tshbeta Promoter-Driven Transgenic Zebrafish Marks Proximal Kidney Tubule Development
- Authors
- Wang, Y., Sun, Z.H., Zhou, L., Li, Z., Gui, J.F.
- Source
- Full text @ PLoS One
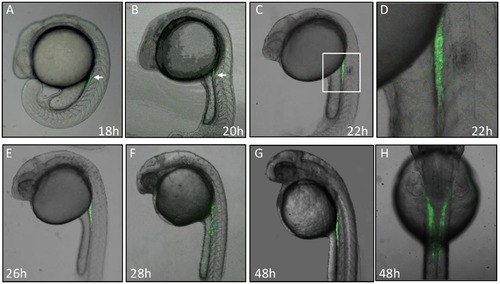
Dynamic GFP expression pattern during embryogenesis in Tg(gtshβ::GFP) line. (A, B, C, E, F and G) show the lateral view of Tg(gtshβ:GFP) embryos at the indicated stages. A dorsal view of 48 hpf embryo is shown in H. The arrows show the expressed GFP in A and B. The boxed area in C was shown with a higher magnification in D. |
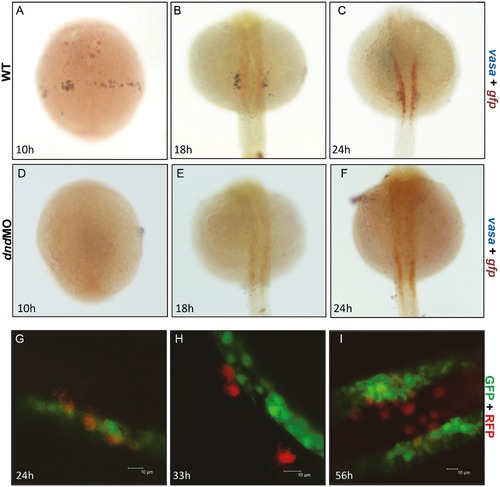
The gtshβ promoter-driven GFP was not localized with PGC. (A–C) dWISH of gfp (red) and vasa (purple) in Tg(gtshβ::GFP) embryos injecting control (A–C) and dnd-morpholino (dnd-MO) (D–F). (G–I) Tg(gtshβ::GFP) embryos injected with RFP-nos 32UTR mRNA (red) were observed using confocal microscopy at the indicated stages. Bar = 10 μm. |
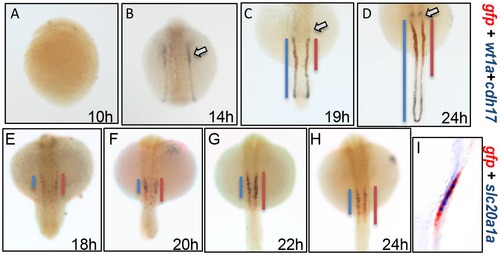
The gtshβ promoter-driven GFP is expressed in pronephric tubules. (A–D) dWISH analyses of gfp (red), wt1a1 (purple) and cdh17 (purple) in Tg(gtshβ::GFP) embryos at the somitogenic stages from 10 hpf to 24 hpf. (E–H) dWISH analyses of gfp (red) and slc20a1a (purple) in Tg(gtshβ::GFP) embryos at the somitogenic stages from 18 hpf to 24 hpf. (I) Nuance multispectral imaging of gfp-slc20a1a-double-stained Tg(gtshβ::GFP) embryos at 24 hpf. The podocytes stained with wt1a1 are indicated by arrows. The blue or red lines are drawn according to the expression patterns of the kidney tubule markers. |
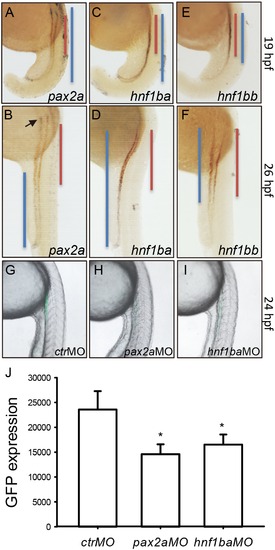
The gtshβ promoter-driven GFP is regulated by Pax2a and Hnf1b. (A–F) dWISH analyses of gfp (red) and kidney transcription factors (purple) as indicated in Tg(gtshβ::GFP) embryos at 19 hpf and 26 hpf. (G–I) show the lateral view of Tg(gtshβ:GFP) embryos injected with morpholinos as indicated at 24 hpf. (J) Fluorophotometric measurement of GFP in the embryos in G–I. The podocyte is indicated by arrow. The blue or red lines are drawn according to the expression patterns of the transcription factors and gfp, respectively. Error bars represent mean ± s.d., *P<0.001 one way AVOVA with Holm-Sidak method. |
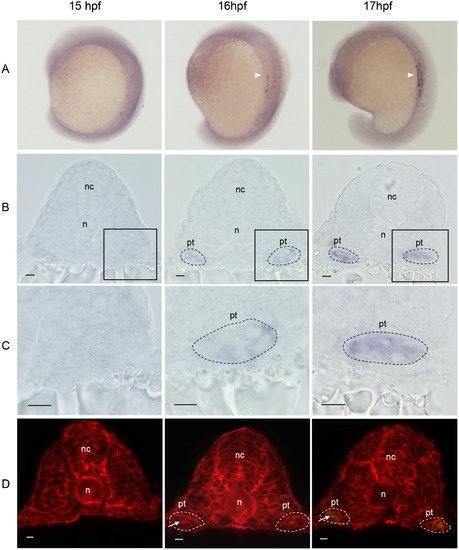
Onset expression of gfp mRNA during somitogenesis in Tg(gtshβ:GFP). (A) WISH analysis of gfp (arrowheads) in 15, 16 and 17 hpf embryos, dorsal-lateral view. (B) Transverse sections of the embryos in A. (C) Higher magnification of boxed regions of B. (D) Cell boundary staining by the RFP-CVLS chimera protein on transverse sections of Tg(gtshβ:GFP) embryos. The gfp-positive cells are outlined by black dash lines. The tubular structures are outlined by white dash lines. Arrows indicate the lumen. nc: neural cord; n: notochord; pt: pronephric tubule. Bar = 10 μm. |
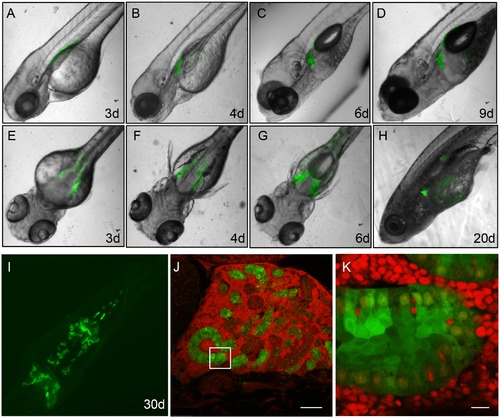
GFP expression pattern in Tg(gtshβ::GFP) larvae and adults. (A–I) show the lateral view (A, B, C, D and H) and the dorsal view (E–G, I) of Tg(gtshβ::GFP) larvae and adults from 3 dfp to 30 dfp. (J) The Tg(gtshβ::GFP) adult kidney section stained with DAPI (red). Bar = 100 μm (K) The higher magnification in the boxed area of J. Bar = 10 μm. |
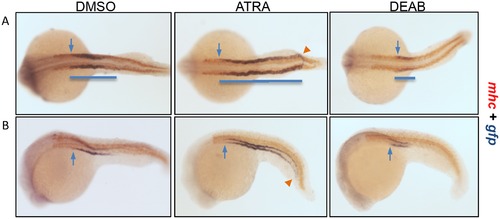
RA signaling regulates pronephric tubule segmentation. The Tg(gtshβ::GFP) embryos at bud stage were treated with DMSO (as control), ATRA or DEAB, and fixed at 22 hpf to perform double whole-mount in situ hybridization with gfp (purple) and mhc (red) probes. (A) Dorsal view. (B) Lateral view. Cloacas are indicated by arrowheads. The most anterior positions of gfp expression are indicated by arrows. The blue lines are drawn to mark the gfp expression patterns. |