
Image
|
Figure Caption
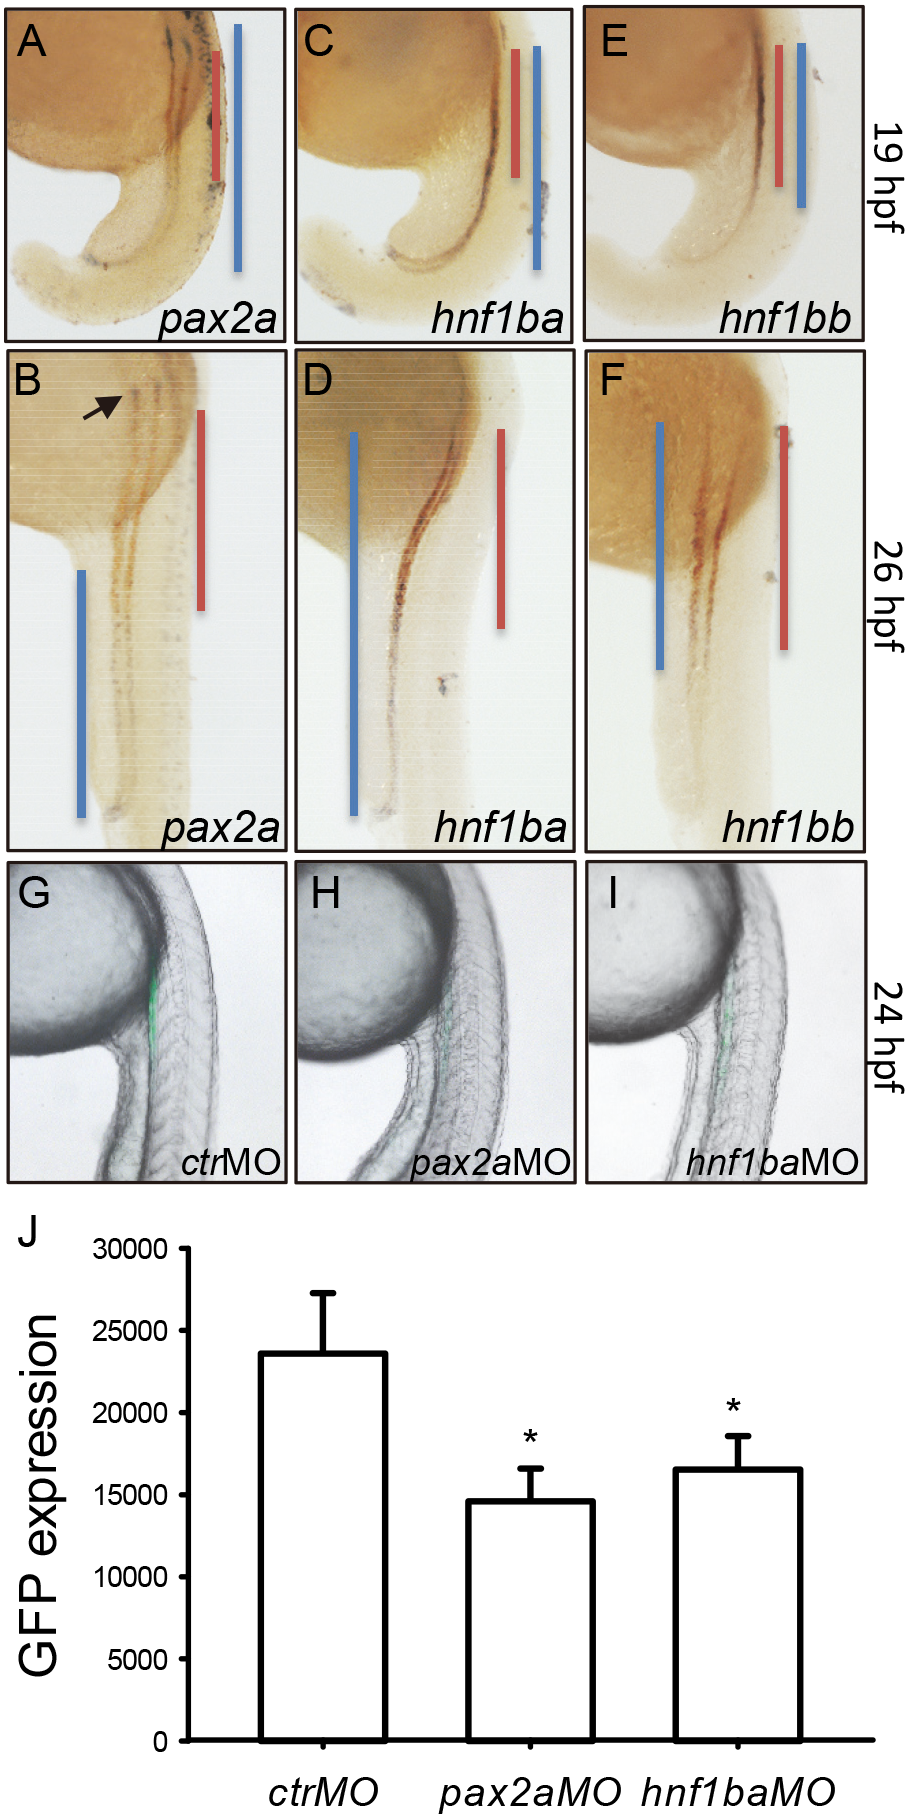
Fig. 5
The gtshβ promoter-driven GFP is regulated by Pax2a and Hnf1b.
(A–F) dWISH analyses of gfp (red) and kidney transcription factors (purple) as indicated in Tg(gtshβ::GFP) embryos at 19 hpf and 26 hpf. (G–I) show the lateral view of Tg(gtshβ:GFP) embryos injected with morpholinos as indicated at 24 hpf. (J) Fluorophotometric measurement of GFP in the embryos in G–I. The podocyte is indicated by arrow. The blue or red lines are drawn according to the expression patterns of the transcription factors and gfp, respectively. Error bars represent mean ± s.d., *P<0.001 one way AVOVA with Holm-Sidak method.
Acknowledgments
This image is the copyrighted work of the attributed author or publisher, and
ZFIN has permission only to display this image to its users.
Additional permissions should be obtained from the applicable author or publisher of the image.
Full text @ PLoS One