
- Title
-
Quantitative phenotyping-based in vivo chemical screening in a zebrafish model of leukemia stem cell xenotransplantation
- Authors
- Zhang, B., Shimada, Y., Kuroyanagi, J., Umemoto, N., Nishimura, Y., and Tanaka, T.
- Source
- Full text @ PLoS One

Schematic representation of the experimental design for LSC inhibitor screening in zebrafish. (A) Cultured K562 cells expressing a Kusabira-orange (KOr) fluorescent protein. Scale bar: 50 μm. (B) Sorting of ALDH- and ALDH+ cell populations. (C) A preparation of zebrafish embryos. Scale bar: 500 μm. (D) Xenotransplantation of ALDH- and ALDH+ cells into zebrafish at 48 hpf. Scale bar: 1.0 mm. (E, F) Xenografted zebrafish were transferred into 96-well plates at 72 hpf, imaged using a high-content imaging system, and then treated with the test compounds. Scale bar: 1.0 mm. (G) At 120 h (48 h after treatment), the xenografted zebrafish were imaged again to evaluate the effects of the chemicals. Scale bar: 1.0 mm. |

ALDH+ K562-KOr cells showed LSC properties. (A) FACS analysis for ALDH+ cells (P1 and P2 indicate the ALDH+ and ALDH- subpopulations, respectively). (B) qPCR for the CSC marker CD133 in ALDH+ cells (C) CD34-positive cells in the ALDH+ cell population (n = 3), *P<0.05. (D) The negative of CD38 and Lin in ALDH+ cells determined by immunofluorescent staining. Blue, nucleus; red, CD38 or Lin. Scale bar: 20 μm. (E) Cell proliferation at 72 h differed in ALDH- and ALDH+ cells (n = 3), **P<0.01. |
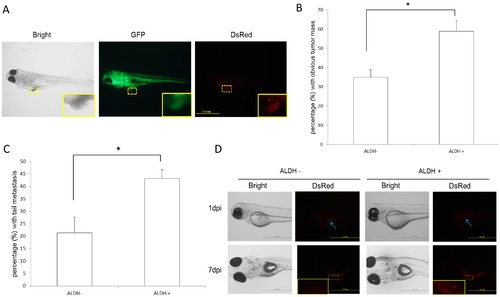
LSC ability in zebrafish xenograft. (A) Typical images of cancer xenografts at 6 days post-injection (dpi). Scale bar: 1.0 mm. The implanted tumor is framed in yellow (the magnification shows the outlined area). (B) In 6-dpi xenografts, ALDH+ cells exhibited greater tumorigenicity than ALDH- cells. P<0.05, based on 3 independent experiments. (C) The distal (tail region) migration of ALDH+ cells was greater than that of ALDH- cells. P<0.05, based on 3 independent experiments. (D) In single cell xenotransplants, ALDH+ cells proliferated at 7 dpi whereas ALDH- cells were no longer detectable. Scale bar: 1.0 mm. The implanted tumor is framed in yellow (the magnification shows the outlined area). |
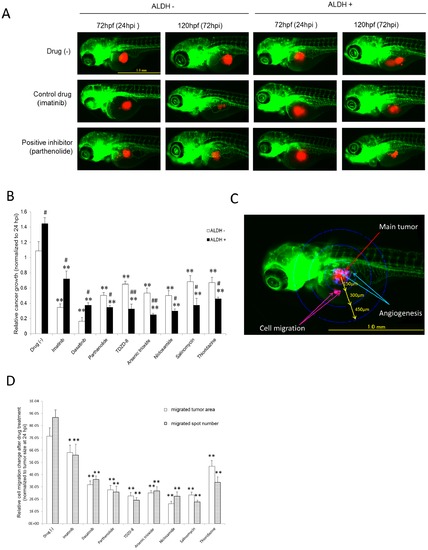
The effects of the test compounds on tumor inhibition in LSC-xenografted zebrafish. (A) Typical images of xenotransplanted zebrafish either not treated or treated with the control drug (imatinib) or an LSC inhibitor (parthenolide). Scale bar: 1.0 mm. (B) Tumor proliferation in xenotransplanted zebrafish. The test compounds (0.5 μM) were administered at 72–96 hpf. The ratio of the fluorescence intensity at 120 and 72 hpf was calculated as an indicator of the increase in tumor size, i.e. tumor proliferation (n = 15–25). P<0.01 vs. no drug; #P<0.05 and ##P<0.01 vs. ALDH- cells. (C) Representative image of the main tumor, angiogenesis, and cell migration. Scale bar: 1.0 mm. (D) Quantitative analysis of cell migration. The number of migrated tumors and their sizes (area) were measured within concentric rings at a defined distance from the main tumor and grouped accordingly. The LSC inhibitors decreased the size and the number of migrated tumors in LSC xenotransplants (n = 15–25). P<0.05 P<0.01 vs. no drug. |

ROS overproduction by the LSC inhibitors. (A) LSC inhibitors (10 µM) significantly inhibited the in vitro proliferation of ALDH+ cells 24 h after treatment (n = 3), **P<0.01. (B) Typical images showing ROS production in ALDH+ cells. LSC inhibitors (10 µM) significantly induced in vitro ROS production in cells treated for 24 h. Blue, nucleus; red, ROS. Scale bar: 50 µm. (C) Quantitative analysis of ROS in the cells (n = 4), **P<0.01. |
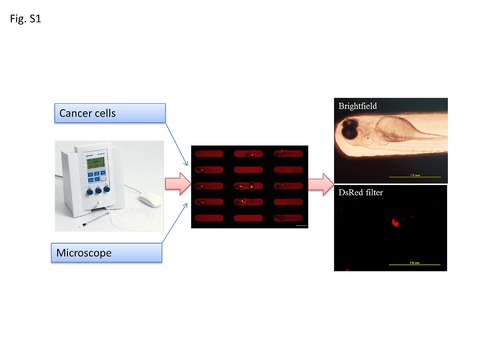
Xenotransplantation procedures. |