
- Title
-
Expression profiling of the RPE in zebrafish smarca4 mutant revealed altered signals that potentially affect RPE and retinal differentiation
- Authors
- Zhang, L., Ma, P., Collery, R., Trowbridge, S., Zhang, M., Zhong, W., and Leung, Y.F.
- Source
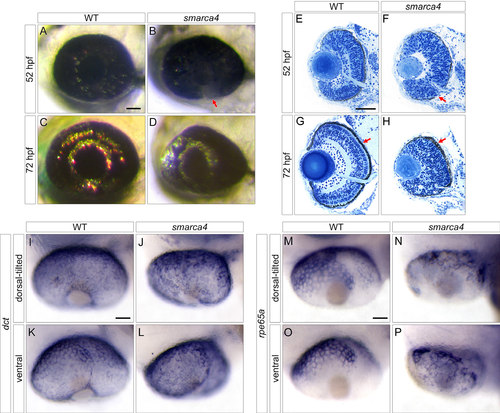
Smarca4 RPE development is abnormal. A-D: Whole-mount wild type (WT) and SWI/SNF-related, matrix associated, actin dependent regulator of chromatin, subfamily a, member 4 (smarca4) eyes at 52 and 72 h post-fertilization (hpf) are shown. The lateral view is shown. Anterior is to the left, and dorsal is up. The red arrow in B indicates a ventral region of smarca4 where the retinal pigment epithelium (RPE) pigmentation level was lower than the other regions. E–H: Transverse histological sections of the WT and smarca4 eyes at 52 and 72 hpf are shown. One distinctive hallmark of smarca4 is the disruption of their retinal lamination. In addition, the smarca4 RPE appears paler (B and E, red arrow) and dysmorphic (H, red arrow) compared with the WT. In these sections, lateral is to the left, and dorsal is up. The RPE differentiation problem was further illustrated with in situ hybridization with dct (I-L) and rpe65a (M-P) at 52 hpf. The expression of dct was comparable between WT and smarca4 RPE, suggesting that the RPE cells in smarca4 were still committed to the pigment cell lineage. Nonetheless, the differentiation of smarca4 was abnormal. This was demonstrated by the slightly irregular staining of dct and very irregular staining of rpe65a, a differentiation marker. In both cases, the dorsal-tilted view (I, J, M, and N) and the ventral view (K, L, O, and P) are shown, and the anterior side is to the left. Scale bars=50 µm. EXPRESSION / LABELING:
PHENOTYPE:
|
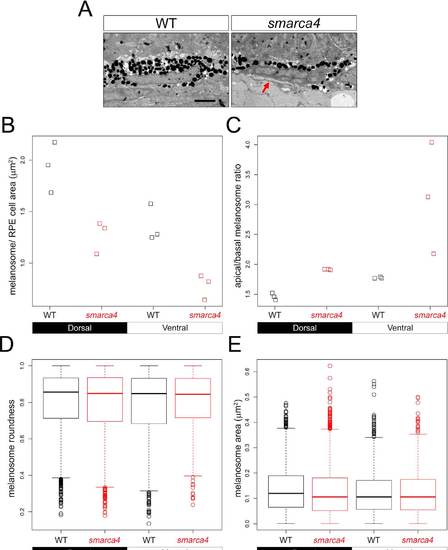
Ultrastructural analysis of smarca4 RPE with transmission electron microscopy at 52 hpf indicates defects in melanogenesis. A: An example retinal pigment epithelium (RPE) cell of wild-type (WT) and smarca4 is shown. The red arrow indicates the basal side of the RPE cell. Scale bar=5 µm. Three whole-eye transverse sections were collected for each genotype and several morphometric measurements of the melanosomes conducted. The results are shown in B-E. B: A strip chart of the number of melanosome per RPE cell area is shown. C: A strip chart of the apical/basal melanosome ratio in the RPE is shown. D: A boxplot of the melanosome roundness (1: round; 0: elongated). E: A boxplot of the melanosome area. The box plot is a graphical representation based on the distribution of the data. The box shows the interquartile range (IQR) and the thick line inside the box shows the median. The dotted lines show the largest or smallest values that fall within 1.5 times the IQR from the closest edge of the box. Values that are outside this range are considered outliers and were plotted as individual circles. In all these plots, the data obtained from the RPE dorsal and ventral to the optic nerve are plotted separately. The corresponding statistical analyses are shown in Appendix 1-Appendix 4, respectively. |