
- Title
-
Overexpression of endothelin 1 triggers hepatocarcinogenesis in zebrafish and promotes cell proliferation and migration through the AKT pathway
- Authors
- Lu, J.W., Liao, C.Y., Yang, W.Y., Lin, Y.M., Jin, S.L., Wang, H.D., and Yuh, C.H.
- Source
- Full text @ PLoS One

Generation and characterization of edn1 transgenic fish. (A) Diagram of the fabp10a:edn1-pA/CG2 construct that contains Tol2 sequences and the cmlc2:GFP expression cassette. (B) The Edn1 protein was expressed in the liver of the wild-type fish carrying the fabp10a:edn1-pA/CG2 transgene, as indicated by the expression of cmlc2:GFP in the heart (green fluorescence, 200X). Scale bars: 2 mm. (C) Quantitative RT-PCR analysis of edn1 mRNA expression in hepatocytes from 3-, 5-, 7-, 9- and 11-month-old edn1 transgenic fish (n = 3) and control fabp10a:GFP-mCherry transgenic fish. For qPCR analysis, a series of known PCR fragment (GFP) of known concentrations were used as the standard. The edn1 RNA concentration was calculated base on the standard curve. The differences between the edn1 transgenic fish and control fish were assessed using a two-tailed Student′s t-test. Asterisks *** represent the P value is less than 0.001. |

Histopathology of edn1 transgenic hepatocytes. (A1–A6) H&E staining of the liver sections from the GFP-mCherry control fish at 11 months (A1), and from the edn1 transgenic fish at 3, 5, 7, 9 months (A2–A6). The images were captured at 200X magnification. The A12–A62 images resemble the A1–A6 images, though they were captured at 400X magnification. H&E staining of liver sections from GFP-mCherry control fish showed normal histology, while edn1 transgenic fish showed normal, steatosis, bile duct dilation, hyperplasia, and HCC at 3, 5, 7, and 9 months. Scale bars: 50 μm. (B). The Tg(fabp10a:GFP-mCherry) and Tg(fabp10a:edn1-pA/CG2) liver sections were stained by H&E (B1 and B2). The same sections were also stained with oil red O (B3 and B4). Tissues from the Tg(fabp10a:edn1-pA/CG2) fish showed positive staining with oil red O in the hepatocytes (400X). Scale bars: 50 µm. (C) The cumulative frequency of steatosis, bile duct dilation, hyperplasia, and HCC in the edn1 transgenic fish was determined by Kaplan-Meier analysis. The different colors denote different liver diseases: steatosis (green), bile duct dilation (blue), hyperplasia (brown), and HCC (red). The differences between the edn1 transgenic fish and control fish were assessed using a two-tailed Student′s t-test. The P value is less than 0.05. |
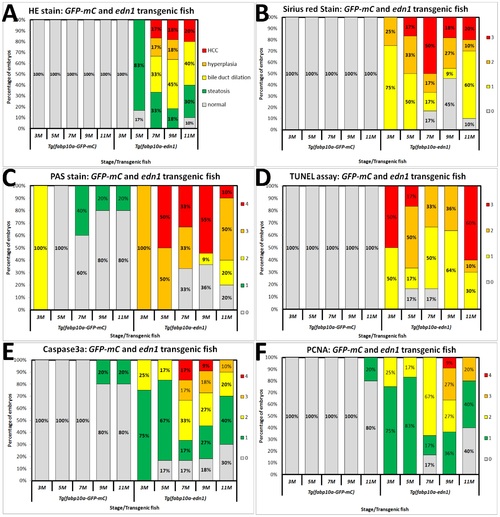
Comparison of hepatocyte histology from GFP-mCherry and edn1 transgenic fish from 3 to 11 months of age. Twenty-seven GFP-mCherry transgenic fish (as control) and thirty-seven edn1 transgenic fish were compared. H&E and additional staining methods were conducted on all the fish samples. (A) Statistical analysis of H&E staining. Different colors denote different pathological features: normal (gray), steatosis (green), bile duct dilation (yellow), hyperplasia (orange), and HCC (red). (B) Liver fibrosis was determined by Sirius Red staining. (C) Glycogen accumulation was identified by Periodic Acid-Schiff (PAS) staining. (D) Apoptosis was examined using the TUNEL assay. (E) Active caspase 3a and (F) Nuclear PCNA expression were assessed by IHC. Different colors represent different pathological scores. There are four possible scores for B and D: 0 (gray), 1 (yellow), 2 (orange), and 3 (red), and five possible scores: 0 (gray), 1 (green), 2 (yellow), 3 (orange), and 4 (red) for C, E and F. The y-axes correspond to “percentage of embryos”. |
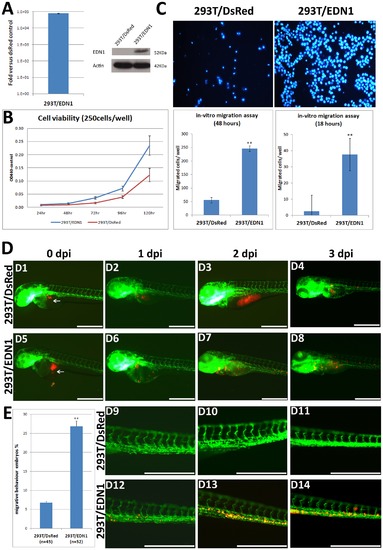
Stable EDN1 overexpression in 293T cells increases cell viability and migration. (A) EDN1 RNA and protein expression in cells stably overexpressing EDN1. Total RNA was isolated from the 293T/EDN1 and DsRed/293T control cells, and the mRNA expression level was determined by qPCR. Data are expressed as mean ± SD showing the ratio of the EDN1 expression in the overexpressed cells versus the control cells. The protein expression was analyzed by Western blotting using an EDN1 antibody. The EDN1 protein was expressed exclusively in the stable 293T/EDN1 cells. (B) A WST-1 assay to measure the viability of 293T/EDN1 cells (blue) and 293T/DsRed cells (red); 250 cells/well were seeded in 6-well plates, and the cell viability was measured at 1, 2, 3, 4 and 5 days after seeding. (C) A Transwell assay to assess the migration ability of 293T/EDN1 cells. The method is detailed in the Materials and Methods. The number of migrating 293T/DsRed control cells and 293T/EDN1 cells at 18 and 48 h are expressed as means ± SD of three independent experiment. (D) 293T/DsRed or 293T/EDN1 cells labeled with CM-Dil (red) were ectopically injected into the yolk sac of 2-dpf Tg(fli1:EGFP) zebrafish embryos. The fli1:EGFP embryos injected with 293T/DsRed control cells (D1–D4) and 293T/EDN1 cells (D5–D8) at 0, 1, 2, and 3 days post-injection (dpi) are shown at a low magnification. The fli1:EGFP embryos injected with 293T/DsRed cells (D9–D11) and 293T/EDN1 cells (D12–D14) at 1, 2, or 3 dpi are shown at a high magnification. Arrows indicate the primary injection site. Scale bar: 50 μm. (E) Quantification of the in-vivo cell migration. The percentage of the 3 dpi embryos showing migration behavior after xenotransplantation of 293T/DsRed cells (as a control) and 293T/EDN1 cells are shown. Forty-five and thirty-two two-day-old fli1:EGFP embryos were injected with DsRed/293T cells and 293T/EDN1 cells, respectively. These cells were examined at 3 dpi for migration behavior with a microscope. The data are presented as the means ± SD. **, P<0.001. |

Expression of p-AKT and AKT in the edn1 transgenic fish. (A) and (D) depict H&E staining of the liver sections of the GFP-mCherry control and edn1 transgenic fish. (B-C) and (E-F) shows the IHC staining using an anti-phospho-AKT antibody (B and E) or an anti-AKT antibody (C and F). |

MiR-1 regulates EDN1 expression in HCC. (A) The RNA expression of miR-1 in the edn1 transgenic fish and human specimens was determined by in-situ hybridization, and EDN1 protein expression in human specimen by IHC. The expression of miR-1 was at the high level in 3-month-old edn1 transgenic fish which is normal in pathological analysis (A1) and was decreased in the 9-month-old edn1 transgenic fish with HCC (A2). The liver tissue of the GFP-mCherry control zebrafish was stained with (A3) or without (A4) the U6 probe as the positive or negative control, respectively. The miR-1 signal was very intense in the normal human liver tissues (A5), but was weakened in the tissue of HCC at stage I to III tissues. (A6–8). The EDN1 signal was very weak in the normal liver tissue (A9), but became intense in the tissue of HCC at stage I to III (A10–12). The positive signal is shown in purple for miR-1 in-situ and brown for EDN1 IHC (200X). Scale bars: 50 μm. (B) Comparison of the expression of EDN1 and miR-1 in normal and HCC tissues. The staining intensity was scored from 0 to 4. ** or ##, P<0.001; *** or ###, P<0.0001. (C) Correlation between EDN1 and miR-1 expression in the hepatic tissue of HCC patients. |
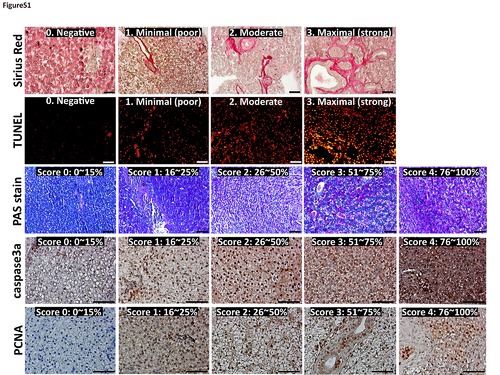
Representative images from different staining methods and their scoring standards. (A) Sirius Red staining (200X), (B) TUNEL assay (200X), (C) PAS staining (200X), (D) caspase 3 staining (400X), and (E) nuclear PCNA staining (400X). Scale bar: 50 μm. |