
- Title
-
Galectin-4 Reduces Migration and Metastasis Formation of Pancreatic Cancer Cells
- Authors
- Belo, A.I., van der Sar, A.M., Tefsen, B., and van Die, I.
- Source
- Full text @ PLoS One
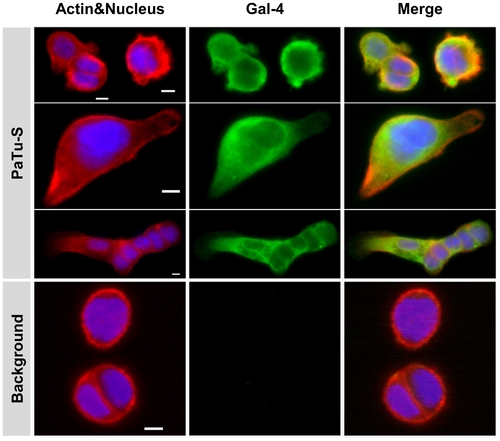
Immunocytochemical localization of Gal-4 in PaTu-S cells. Photographs of representative ICC analysis of the cellular localization of Gal-4 in PaTu-S cells. Gal-4 was detected using Alexa-labeled anti-Gal-4 Abs (green), Actin was stained using Phalloidin (red) and nucleus staining obtained using HOESCHS (blue); the third panel shows the merging of the different stainings. Bar = 25 μm. |
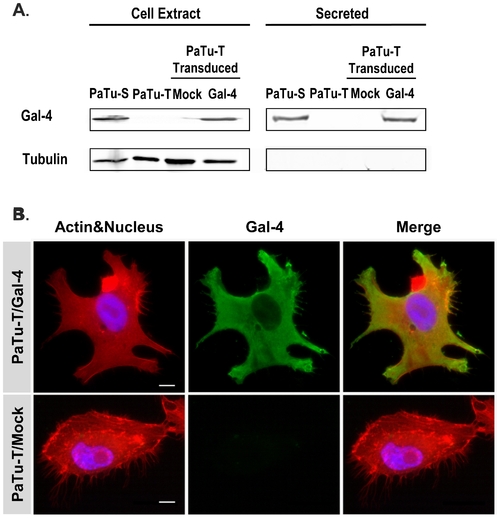
Gal-4 protein levels in PaTu-S and PaTu-T cells, and localization of Gal-4 in PaTu-T/Gal-4. A) Proteins from whole-cell extracts (75 ug total protein) and culture medium (4 days culture, 25 ul) of PaTu-S (P-S), PaTu-T (P-T), PaTu-T/Gal-4 (P-T/Gal-4) and PaTu-T/mock (P-T/M) were separated by SDS-PAGE. After transfer of the proteins to a nitrocellulose membrane, the blots were stained using goat anti-hGal-4 for detection of Gal-4, and mouse anti-tubulin as control for the presence of intracellular protein. B) Photographs of representative ICC analysis of the cellular localization of Gal-4 in PaTu-T/Gal-4 and PaTu-T/mock cells. Gal-4 was detected using Alexa-labeled anti-Gal-4 Abs (green), Actin was stained using Phalloidin (red) and nucleus staining obtained using HOESCHS (blue); the third panel shows the merging of the different stainings. Bar = 25 μm. |
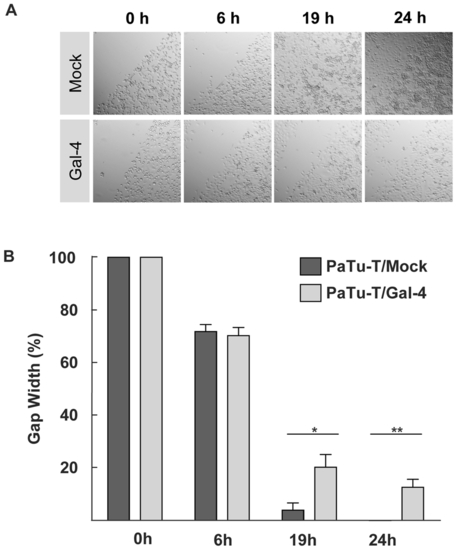
In vitro cell migration of PaTu-T cells. A scratch (wound healing) assay was performed with PaTu-T, PaTu-T/Gal-4 and PaTu-T/mock cells. PaTu-T/mock and PaTu-T/Gal-4 cells were seeded on a 24 well plate and scratched on the surface with a 200-μl pipette tip. Relative values were set at 100% of the gap width at the time of the scratch. A) Representative photographs at time points 0, 6, 19 and 24 hours after the wound (scratch) for all conditions are depicted. B) Histogram representation of data analyzed from photographs taken at 0 h; 6 h, 19 h and 24 h after the scratch. Measurements were done in duplicate in 3 separate experiments, and data are depicted as average gap width ± SEM. (* pd0.05 and ** pd0.01, using one way ANOVA Tukey t tests). |
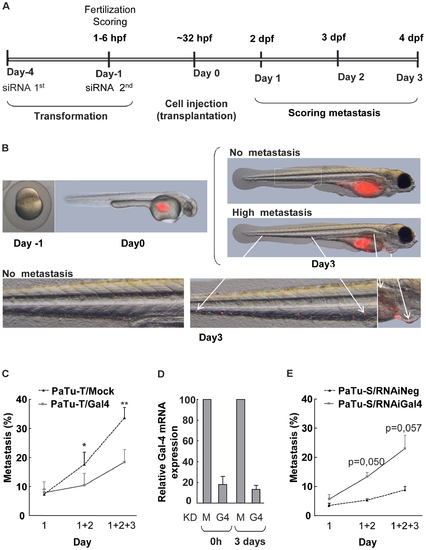
Metastasis assay of zebrafish casper embryos transplanted with PaTu-S and PaTu-T cells. A) Schematic depiction of the time schedule of the transplantation experiments. Embryos were injected at the yolk sack at 32–38 h developmental stage. siRNA was introduced twice at day -4 and day -1, respectively. At 1–6 hours post fecundation (hpf) the embryos were evaluated for viability and fitness. Scoring of metastasis formation was performed at day 1, 2 and 3 by detection of the localization of CMDiI (red) fluorescent cells. B) Representative photographs of a casper embryo at one cell developmental stage, and an embryo injected with fluorescent red cells. At day 0 cells are present only at the yolk sac of the embryo and at day 3 cells had migrated from the yolk sac throughout the embryo, including the caudal vein, hart and liver. C) Metastasis assay of zebrafish casper embryos transplanted with PaTu-T/Gal-4 and PaTu-T/mock cells. The number of embryos presenting metastasis is shown per day and the total percentage of embryos with metastasis formation after 3 days is depicted as a histogram. The data are derived from 4 separate experiments, and are depicted as the average metastasis formation ± SEM. D) Gal-4 mRNA levels of PaTu-S/Gal-4 KD (KD G4) and mock siRNA treated (KD M) PaTu-S cells were determined by quantitative RT-PCR as a control for the efficiency of the siRNA treatment. E) Histogram showing the total percentage of embryos, transplanted with fluorescent PaTu-S/mock-KD and PaTu-S/Gal-4-KD cells, with metastasis formation after 1–3 days. Data are derived from 3 separate experiments, and are depicted as average metastasis formation ± SEM. Significance of the data is determined by paired sample T-tests (* pd0.05, ** pd0.01 and, *** pd0.001). |