
- Title
-
The embryonic expression patterns of zebrafish genes encoding LysM-domains
- Authors
- Laroche, F.J., Tulotta, C., Lamers, G.E., Meijer, A.H., Yang, P., Verbeek, F.J., Blaise, M., Stougaard, J., and Spaink, H.P.
- Source
- Full text @ Gene Expr. Patterns
|
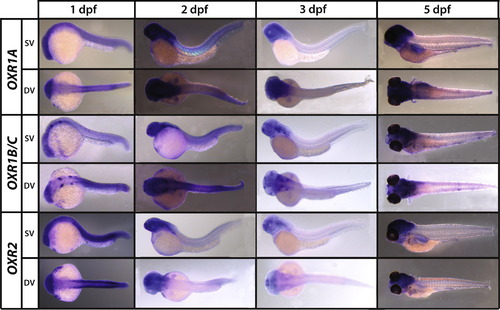
LysMD (panel A) and OXR (panel B) genes expression patterns during stages of zebrafish development. Whole mount in situ hybrizations using alkaline phosphatase detection and a blue chromogenic substrate. Embryos are orientated with the anterior to the left and dorsal to the top and shown in side view (SV) or dorsal view (DV) at four developmental stages (1,2,3 and 5 dpf). 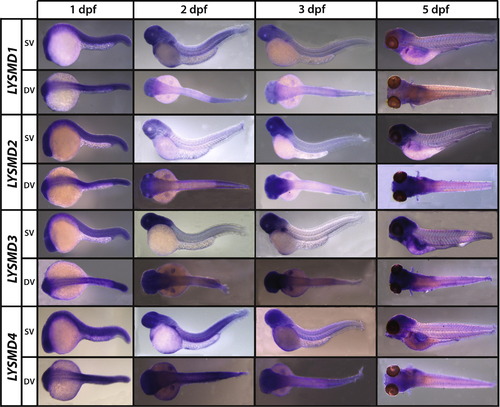
|
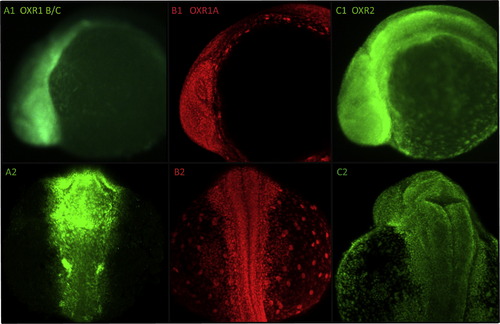
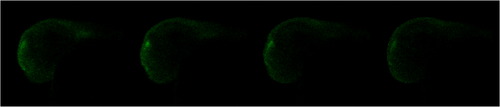
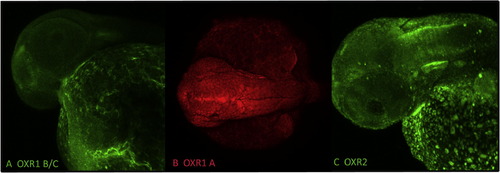
Expression patterns of OXR genes with FISH in 24 hpf zebrafish embryos. The images are maximum intensity projections from confocal z-series of OXR1B/C (fluorescein green, in A1, A2), OXR1A (Cy3 red in B1, B2) and OXR2 (fluorescein green, in C1, C2). The embryos (A1, B1, C1) are orientated with the anterior to the left and the embryos (A2, B2, C2) are orientated with the anterior to the top and shown in dorsal view. EXPRESSION / LABELING:
|
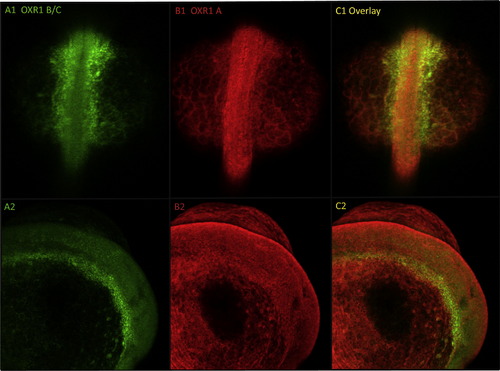
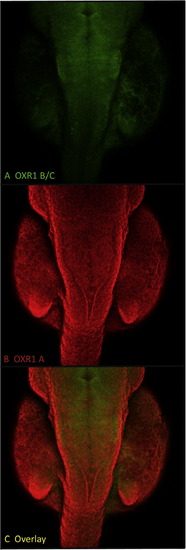
The expression patterns of OXR1A and OXR1B/C in 24 hpf zebrafish embryo with double in situ hybridizations (DISH). The images are maximum intensity projections from dual channel confocal z-series. OXR1B/C is shown in green (fluorescein, A1, A2). OXR1A is shown in red (Cy3 dye, B1, B2). The merged channels from OXR1B/C and OXR1A are shown in yellow (C1, C2) for a comparison. The embryo (A1, B1, C1) is orientated with the anterior to the top and shown in dorsal view. The same embryo (A2, B2, C2) is orientated with the anterior to the right and shown in side view. EXPRESSION / LABELING:
|
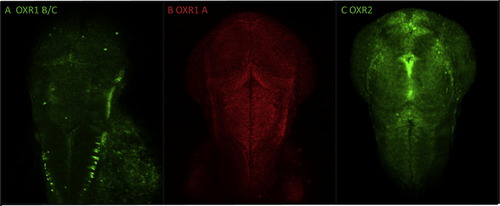
OXR1 and OXR2 RNA FISH expression patterns at 48 hpf in zebrafish embryos. The images are maximum intensity projections from laser scanning confocal z-series of OXR1B/C (fluorescein, A), OXR1A (Cy3, B) and OXR2(Fluorescein, C). The embryos are orientated with the anterior to the top and presented in dorsal view. EXPRESSION / LABELING:
|
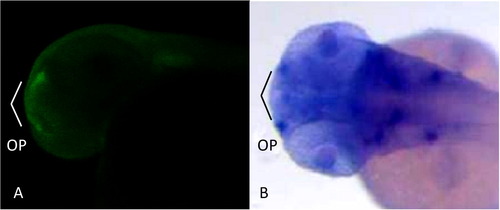
OXR1 B/C expression in the olfactory pits of zebrafish embryos at 48 hpf. FISH and WISH comparison (A) Maximum intensity projection of stacks, covering <20 μM, from fluorescein Z-series OXR1B/C at 48 hpf (B) WISH OXR1 B/C at 48 hpf. Embryos are orientated with the anterior to the left and shown in side view (A) or dorsal view (B). EXPRESSION / LABELING:
|
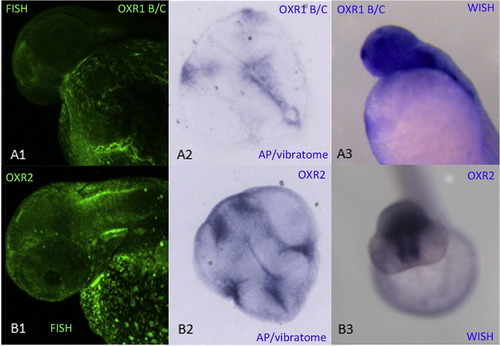
OXR1 and OXR2 expression in 48 hpf zebrafish embryo brain. The WISH and FISH expression pattern are compared with representative brain micro-sections. (A1) Maximum intensity projection from fluorescein confocal z-series of OXR1 B/C. (A2) OXR1 B/C transversal 6 μm thick section (A3) OXR1 B/C WISH (B1) maximum intensity projection of OXR2 fluorescein confocal z-series (B2) OXR2 transversal 6 7mu;m thick section, (A3) OXR2 WISH for a comparison. The embryos (A1, B1, A3) are orientated with anterior to the left and shown in side view. Embryo (B3) is orientated with the anterior to the back and shown in frontal view. EXPRESSION / LABELING:
|
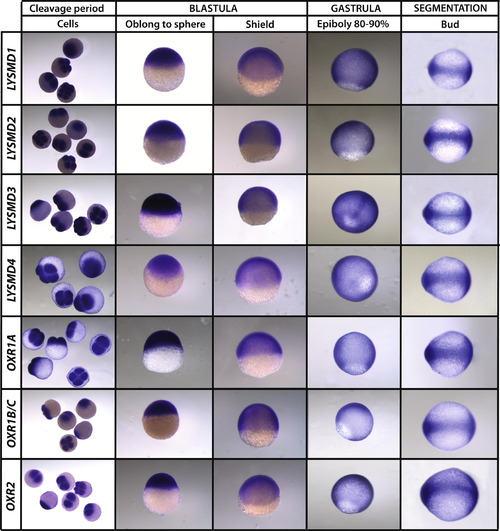
LysM-domain encoding genes WISH ubiquitous expressing pattern during during early zebrafish embryonic development. From cell cleavages to segmentation, through blastulation and gastrulation of the zebrafish embryos. |
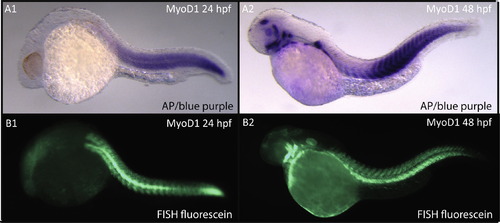
Technical validation of alkaline phosphatase detection versus fluorescein detection. A blue chromogenic substrate detection is compared to a fluorescent detection system using MyoD1 as a reference expression pattern. The 48 hpf zebrafish embryos are orientated with the anterior to the left and are presented in side view. |
Technical validation of alkaline phosphatase detection versus fluorescein detection. A blue chromogenic substrate detection is compared to a fluorescent detection system using MyoD1 as a reference expression pattern. The 48 hpf zebrafish embryos are orientated with the anterior to the left and are presented in side view. |
DISH expression patterns of OXR1A and OXR1B/C in 48 hpf zebrafish embryos. The images are maximum intensity projections from dual channel confocal z-series showing OXR1B/C and OXR1A expression patterns. (A, green) OXR1 B/C with fluorescein detection, (B, red) OXR1A with Cy3 detection, (C, yellow) merged channels for a comparison. Embryos are orientated with the anterior to the top and shown in dorsal view. |
DISH expression patterns of OXR1A and OXR1B/C in 48 hpf zebrafish embryos. The images are maximum intensity projections from dual channel confocal z-series showing OXR1B/C and OXR1A expression patterns. (A, green) OXR1 B/C with fluorescein detection, (B, red) OXR1A with Cy3 detection, (C, yellow) merged channels for a comparison. Embryos are orientated with the anterior to the top and shown in dorsal view. |
Reprinted from Gene expression patterns : GEP, 13(7), Laroche, F.J., Tulotta, C., Lamers, G.E., Meijer, A.H., Yang, P., Verbeek, F.J., Blaise, M., Stougaard, J., and Spaink, H.P., The embryonic expression patterns of zebrafish genes encoding LysM-domains, 212-24, Copyright (2013) with permission from Elsevier. Full text @ Gene Expr. Patterns