
- Title
-
Neurogenesis of retinal ganglion cells is not essential to visual functional recovery after optic nerve injury in adult zebrafish
- Authors
- Zou, S., Tian, C., Ge, S., and Hu, B.
- Source
- Full text @ PLoS One
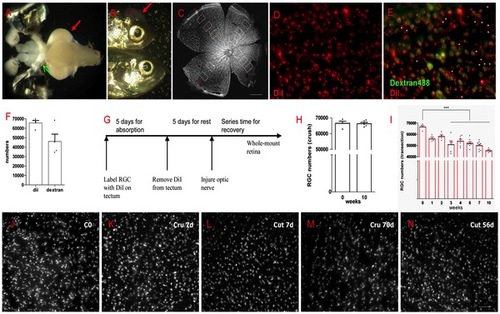
Most RGCs survived after ONI. (A) Two methods were used to label RGCs, the red arrow indicates DiI placed on tectum, the green arrow indicates Dextran 488 at optic nerve stump. (B) The red arrow shows lightcuring bond on the skull to prevent DiI lost. (C) The sampling of RGCs counting in the entire retina. (D) An example of DiI labeled RGCs. (E) Merge DiI and Dextran labeled RGCs in the same field. Asterisks indicate cells labeled by DiI but not by Dextran488. (F) Though the number of labeled cells has no significant difference (p>0.05) between DiI and Dextran, retrograde labeling with DiI is more reliable. (G) A scheme of DiI labeling in RGC survival experiment. (H) Almost all RGCs survived in ONC model after 10 weeks. (I) Significant RGCs lost began at 3 weeks (about 20% lost) but over 70% of RGCs were still alive at 10 weeks after ONT, p<0.001. (J-N) Representative pictures show RGCs at different time in ONC or ONT model. * indicates p<0.05, *** is p<0.001. Scale bar: 200 μm (C); 10 μm (E); 30 μm (J-N). |

RGCs regenerated quickly and no new RGCs were found. (A) Scheme of DiI labeling in RGC regeneration experiment. (B) In ONC model, over 90% of RGCs regenerated to their targets in the first week. (C) In ONT model, over 50% of RGCs regrew axons to tectum at 1 week post lesion (p<0.01, compared to normal) and the number was still significant compared to the normal animals after 3 weeks (n = 6, p<0.05). After 4 weeks, RGCs number was about 90% of normal fish and was no significant difference compared with normal (n = 3, p>0.05). (D) Periphery RGCs regrew axons to tectum more quickly than central ones during at the first week. (E) A scheme of DiI labeling RGC survival and Dextran labeling RGC regeneration in the same retina. (F-H) After 2 weeks post ONT, Dextran488 only marked RGCs were rarely found in the whole retina. (I) 6 days after ONT, BrdU+ cells could be found in the GCL and INL, but those cells did not co-localize with Dextran568 labeled RGCs. (J-L) Details of the white square in (I). Abbreviations: Neurofiber layer (NFL), retinal ganglion cell layer (RGCL), inner plexiform layer (IPL), inner nuclear layer (INL), outer plexiform layer (OPL), outer nuclear layer (ONL), photoreceptor inner segment/outer segment (IS/OS), and retinal pigment epithelium (RPE). * indicates p<0.05, ** is p<0.01. Scale bar: 100 μm (D); 50 μm (I); 10 μm (F-H, J-L). |
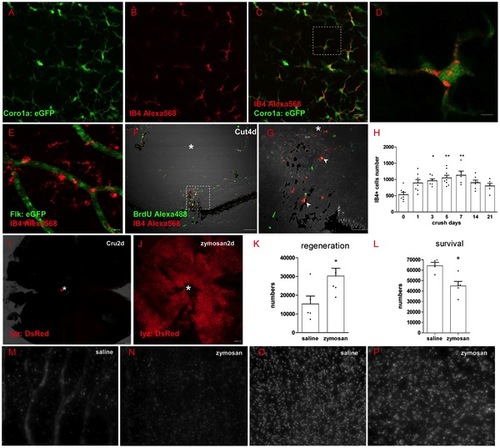
Inflammation has dual-roles during regeneration (A-D) IB4+ cells in retina are colocalized with coro1a:eGFP in Tg(coro1a:eGFP; lyz:DsRed) fish, which means IB4+ cells mark microglia cells in zebrafish retina. (D) Shows the detailed view of square in (C). (E) IB4+ cells could not colocalize with flk:GFP in transgenic Tg(flk:GFP) line. (F-G) BrdU marker shows that some IB4+ cells are newborn in retina (arrowhead in G), * indicates the lens. (H) IB4+ cells number in all layers of retina changed with time, increasing significantly 3 days to 7 days after ONC, then decreasing to normal level after 14 days. (I-J) Zymosan induces acute neutrophil/macrophage infiltration into retina, * indicates optic disc. (K, M and N) Neutrophil/macrophage infiltration into retina could increase the number of regenerated RGCs in the first week after ONT, but decrease RGCs survival after 2 weeks (L, O and P). * indicates p<0.05, ** is p<0.01. Scale bar: 10 μm (A-C, M-P); 2 μm (D); 30 μm (G), 100 μm (F, I and J). |
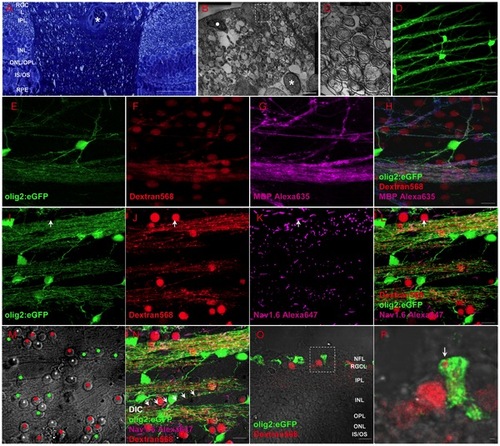
Oligodendrocytes exist within retina of adult zebrafish. (A) Toluidin blue staining shows myelin structure through the lamina cribrosa into the retina. (B-C) TEM images show that the axons of RGCs are specially and loosely wrapped by myelin. (D) Olig2:eGFP cells in retina have perfect structure of oligodendrocyte cells that project several processes to vicinal axons in Tg(olig2:eGFP) transgenic line. (E-H) Combination of Dextran568 labeled RGCs and MBP staining show olig2+ eGFP expression on mature oligodendrocytes in NFL. Notice that only the myelin ensheathed axons are MBP positive. (I-N) With Ranvier node on myelin, oligodendrocytes in zebrafish retina are in mature state. Arrow in (I-L) points out an axon hillock near RGC soma, and it should be noticed that olig2+ process dose not wrap this area. Red dots in (M) indicate RGCs, green dots are olig2+ cells and * indicates non-labeled cells, a row of arrows in (N) show an axon is wrapped by olig2+ process. (O) Crossing section indicates that axon retrogradely labeled by Dextran568 is wrapped by olig2+ eGFP. (P) Details of the white square in (O). Scale bar: 50 μm (A); 2 μm (B); 200 nm (C); 10 μm (D-O); 1 μm (P). |
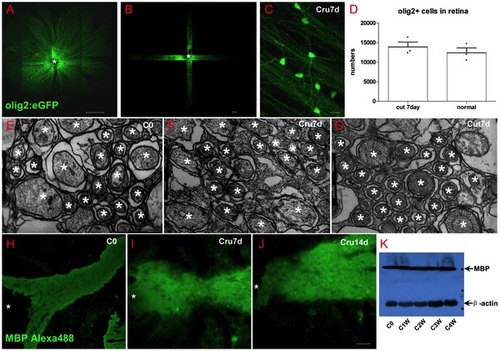
Oligodendrocytes in retina did not decrease after optic nerve injury. (A) Scan the whole retina with 10× objective of LSM710. (B) Cruciated scan in 3D way for counting the destiny of olig2+ cells. (C) The processes of oligodendrocytes keep integrality after ONI. (D) Oligodendrocytes number did not decrease at one week after ONT. (E-G) TEM images also show that myelin structure within NFL keeps integrity in ONC or ONT model within the first week. (H-J) Both IHC and western blot results (K) indicated that MBP in retina was not decreased after optic nerve injury, * indicates lens; Scale bar: 200 μm (A); 50 μm (B, H-J), 10 μm (C); 200 nm (E-G). |

(A, B) The density of Ranvier node in optic disc is not influenced by optic nerve injury. (C) Quantitative result shows Ranvier node density in disc is not decreased following ONI. (D) OMR result shows gradual recovery of visual function. After 5 weeks of binocular optic nerve crush, concordant ratio returns to normal level (p>0.05) and visual function is completely recovered at 9 wpi (100% recovery). ** indicates p<0.01, *** is p<0.001. Scale bar: 10 μm (B). |

Number of DiI labeled RGCs (A) is about two third of DAPI numbers (B) in whole retina. Scale bar: 40 μm (B). |
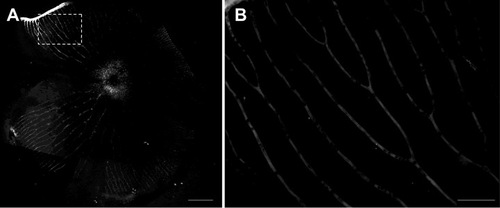
(A) Regenerated RGCs could not be found at 5 days after ONT, the large view is shown in (B).Scale bar: 200 7mu;m (A); 50 μm (B). |
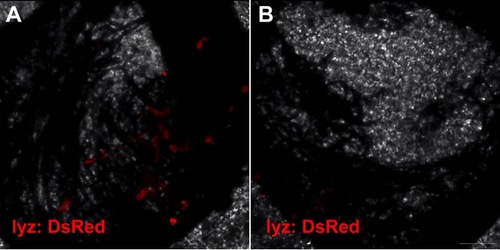
Neutrophils (lyz: DsRed) were rarely found in the retina except in the disc during the first 3 days after ONC (A) and then disappeared at 7 dpi again (B). Scale bar: 30 μm (B). |
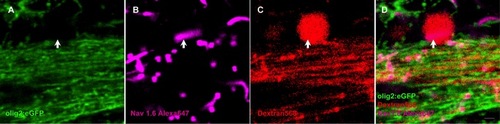
Myelin process does not wrap axon at the site of axon hillock (arrow).These arrows are the same in Figure 4I-L. Scale bar: 2 μm (D). |