
- Title
-
Plexin a3 and turnout regulate motor axonal branch morphogenesis in zebrafish
- Authors
- Sainath, R., and Granato, M.
- Source
- Full text @ PLoS One

turnout mutants display guidance and branching defects and maps to chromosome 24 (A) Antibody staining of 24 hpf wild-type embryos to visualize motor axon projections. Note that axons exit the spinal cord at the midsegmental exit point (asterisk) with no branches. (B) In turnout mutants, motor axons exit the spinal cord at ectopic locations (open arrow), and also display long peripheral branches (arrowhead). (C) Genetic map surrounding the turnout locus. Genetic markers and the number of associated recombinant meioses to the left (red text) and to the right (green text) of the turnout mutation are indicated. (D) The physical map of the critical region and annotated genes in this interval. (E) List of annotated genes. Scale bar, 15 µm. |
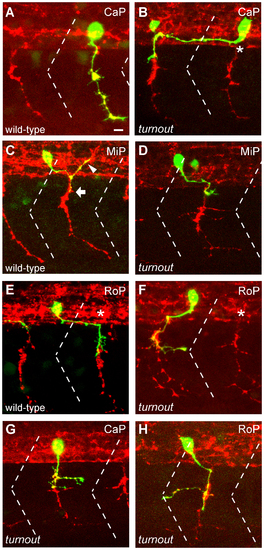
turnout controls guidance and branching of primary motor axons. (A, C, E) 24 hpf wild-type embryos injected with mnx1:GFP to visualize individual CaP, MiP and RoP motor neurons, and counter-stained with the SV2 antibody (red) to visualize the segmental exit points (asterisks). (B) A turnout CaP motor neuron projecting rostrally within the spinal cord, and exiting from an adjacent hemisegments midsegmental exit point. (D) A MiP motor neuron failing to migrate upon exit from the spinal cord. (F) A RoP motor axon projecting rostrally and exiting from an adjacent hemisegment exit. (G, H) turnout CaP and RoP motor neurons with correct axonal trajectories and ectopic branches. Dashed line indicates somite boundary. Scale bar, 10 µm. |
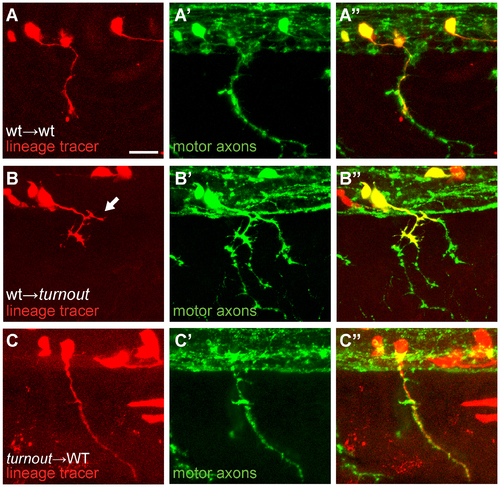
The turnout gene acts cell non-autonomously. (A, B, C) Donor cells are labeled with rhodamine dextran (red), and host embryos were stained with SV2 antibody (green) to reveal all motor axonal trajectories. (A) Wild-type donor-derived neurons (red) in a wild-type host display no guidance or branching defects (0/20). (B) Wild-type donor-derived neurons in a mutant host display precocious branching upon exiting the spinal cord (arrow, 9/18). (C) Mutant donor-derived motor axons display no defects in a wild-type host environment (0/6). Scale bar, 15 µm. |
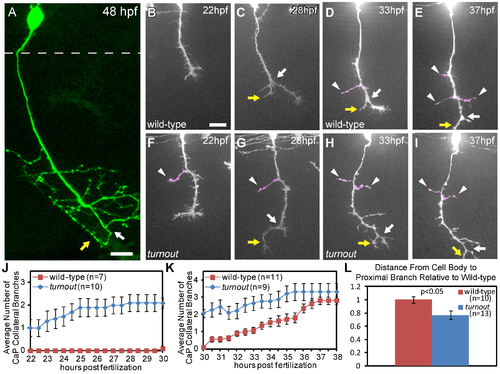
The turnout gene controls where and when collateral CaP axon branches form. (A) 48 hpf wild-type embryo with a single mnx1:GFP positive CaP motor axon. Note that the axon is devoid of branches along the proximal axon shaft, and that collateral branches only form along the distal axon segment, adjacent to the bifurcation branch (white arrow) with one branch turning rostrally (yellow arrow) and one caudally. Dashed line indicates spinal cord boundary. (B, C) Time-lapse of wild-type CaP axons traversing the ventral myotome between 22 hpf and 30 hpf. (D, E) In wild-type embryos, branching begins at ∼30 hpf, typically by axon bifurcation (arrow), followed by the formation of axon collateral branches (arrowhead). (F, G) turnout CaP axons form precocious collateral branches (arrowhead). (H, I) turnout axon collateral branching plateaus between 30 hpf and 38 hpf. (J) Quantification of CaP axon branches between 22–30 hpf. (K) Quantification of CaP axon branches between 30–38 hpf. (L) Quantification of the location of the first proximal collateral relative to wild-type at 48 hpf. Branches are defined as protrusions longer than 5 µm that persist for longer than 2 hours. Error bars indicate SEM. Scale bar, 15 µm. PHENOTYPE:
|
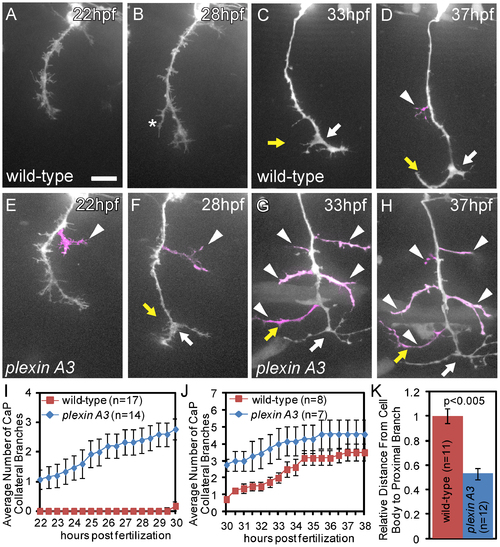
Plexin A3 controls where and when collateral CaP axon branches form. (A, B) Time-lapse of a wild-type CaP axon traversing the ventral myotome between 22 hpf and 30 hpf. (C, D) Time-lapse of a wild-type sibling embryo, demonstrating that branching begins at ~30 hpf, typically with axonal bifurcation (arrow) followed by axon collateral formation (arrowhead). (E, F) In plexin A3 mutants, collateral branches (arrowhead) form precociously between 22 and 30 hpf. (G, H) In plexin A3 mutants collateral formation plateaus between 30 hpf and 38 hpf. (I) Quantification of CaP primary axon branches between 22–30 hpf. (J) Quantification of CaP primary axon branches between 30–38 hpf. (H) Quantification of the spatial location of the first proximal collateral relative to wild-type at 48 hpf. Error bars indicate SEM. Scale bar, 15 µm. PHENOTYPE:
|
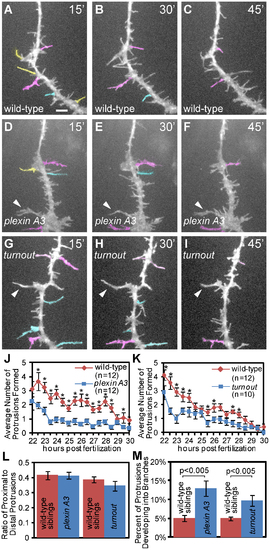
Between 22 and 30 hpf plexin A3 mutant axons initiate fewer short term protrusions but stabilize more into branches. (A, B, C) Representative still images from a time lapse movie of a wild-type CaP axon (D, E, F) Representative still images from a time lapse movie of a plexinA3 mutant CaP axon. (G, H, I) Representative still images from a time lapse movie of a turnout mutant CaP axon. Yellow: protrusions greater than 5 µm with a lifetime of less than 30 minutes. Cyan: protrusions with a lifetime of 30–45 minutes. Magenta: protrusions with a lifetime of 45–60 minutes. Arrowheads indicate stable, permanent branches. (J) Quantification of the average number of new plexin A3 mutant protrusions formed over time. (K) Quantification of the average number of new turnout mutant protrusions formed over time. (L) Quantification of the ratio of proximal to distal protrusions formed indicates the location of protrusions extended. (M) Percentage of protrusions that develop into branches. Error bars indicate SEM. Scale bar, 5 µm. PHENOTYPE:
|
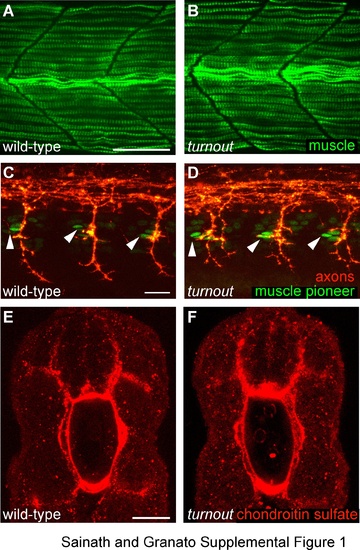
Muscle fiber development, muscle pioneer specification and position and extracellular matrix appear unaffected in turnout mutant embryos. (A, B) Lateral view of 28 hpf wild-type. Scale bar, 25 µm. (A) and turnout (B) mutant embryos stained with the F59 antibody which recognizes myosin heavy chain in adaxial cell derived slow-twitch muscles cells indicates appropriate muscle fiber development and somite morphology. (C, D) Lateral view of 25 hpf wild-type (C) and turnout (D) embryos stained with the 4D9 antibody, which recognizes the nuclear Engrailed epitope in muscle pioneers indicates the correct number and position of pioneers cells present in each hemisegment located rostrally at the horizontal myoseptum. Scale bar, 20 µm. (E, F) Cross section of 24 hpf wild-type (E) and turnout (F) embryos stained with the chondroitin sulfate proteoglycan antibody indicates proper deposition of the extracellular matrix surrounding the spinal cord and the notochord. Scale bar, 25 µm. |