
Fig. 6
- ID
- ZDB-FIG-130320-10
- Publication
- Sainath et al., 2013 - Plexin a3 and turnout regulate motor axonal branch morphogenesis in zebrafish
- Other Figures
- All Figure Page
- Back to All Figure Page
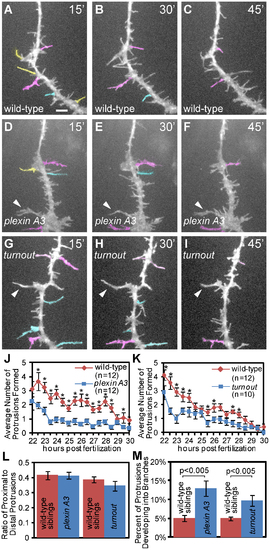
Between 22 and 30 hpf plexin A3 mutant axons initiate fewer short term protrusions but stabilize more into branches. (A, B, C) Representative still images from a time lapse movie of a wild-type CaP axon (D, E, F) Representative still images from a time lapse movie of a plexinA3 mutant CaP axon. (G, H, I) Representative still images from a time lapse movie of a turnout mutant CaP axon. Yellow: protrusions greater than 5 µm with a lifetime of less than 30 minutes. Cyan: protrusions with a lifetime of 30–45 minutes. Magenta: protrusions with a lifetime of 45–60 minutes. Arrowheads indicate stable, permanent branches. (J) Quantification of the average number of new plexin A3 mutant protrusions formed over time. (K) Quantification of the average number of new turnout mutant protrusions formed over time. (L) Quantification of the ratio of proximal to distal protrusions formed indicates the location of protrusions extended. (M) Percentage of protrusions that develop into branches. Error bars indicate SEM. Scale bar, 5 µm. |
| Fish: | |
|---|---|
| Observed In: | |
| Stage Range: | 26+ somites to Prim-5 |