
- Title
-
Characterization of the calcium binding protein family in zebrafish
- Authors
- Di Donato, V., Auer, T.O., Duroure, K., and Del Bene, F.
- Source
- Full text @ PLoS One
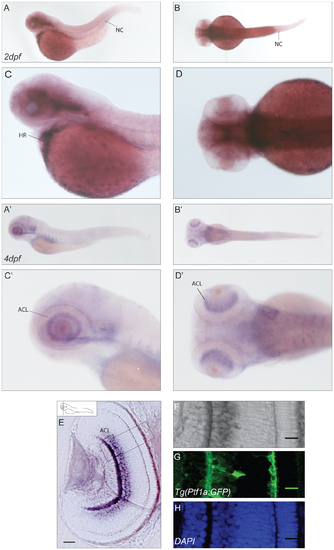
Expression pattern of cabp1a. (A–D2) mRNA expression of cabp1a in lateral (A–A2) and dorsal (B,B2) views of a 2dpf and 4dpf zebrafish embryo with higher magnifications (C–D,C2–D2). (E–H). Cross-sections of retinae in the Tg(Ptf1a:GFP) transgenic line show staining of cabp1a in the amacrine cell layer.(E) Epifluorescence picture of a sectioned retina. Scale bar: 50 µm (F–H) Confocal images of the area selected in E. (F) In situ signal in bright field, (G) GFP signal restricted to amacrine cells, (H) DAPI nuclear stain. Scale bar: 20 µm. HR: heart, NC: notochord, ACL: amacrine cell layer. |
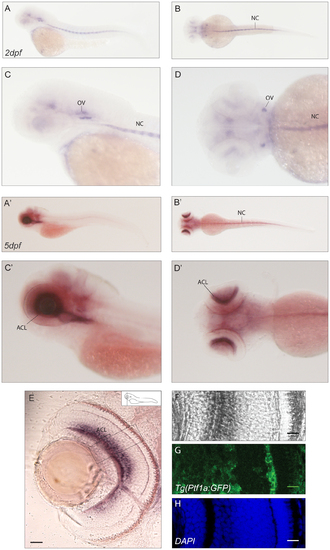
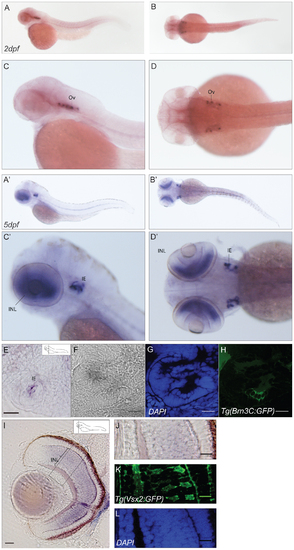
Expression pattern of cabp1b. (A–D2) Expression in 2dpf (A–D) and 5dpf (A2–D2) zebrafish embryos: lateral (A,C–A2,C2) and dorsal (B,D–B2,D2) views. At 2dpf a signal in the otic vesicles and the notochord can be detected. At 5dpf expression in the notochord and the amacrine cell layer of the retina is seen. (E–H). Cross-sections of retinae in the Tg(Ptf1a:GFP) transgenic line show staining of cabp1b in the amacrine cell layer.(E) Epifluorescence picture of a sectioned retina. Scale bar: 50 µm (F–H) Confocal images of the area selected in E. (F) In situ signal in bright field, (G) GFP signal restricted to amacrine cells, (H) DAPI nuclear stain. Scale bar: 20 µm. OV: otic vesicle, NC: notochord, ACL: amacrine cell layer. |
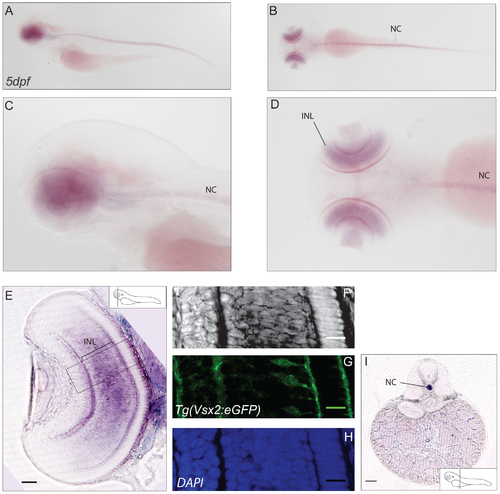
Expression pattern of cabp2a. (A–D) In situ hybridisation showing expression of cabp2a in 5dpf larvae. Lateral views (A,C) , dorsal views (B, D). Cabp2a antisense probe exhibits diffuse retinal localisation; a strong staining is also present along the notochord. (E–H) Cross-section of a retina in the Tg(Vsx2:GFP) transgenic line. (E) Epifluorescence image of a sectioned retina, showing prominent expression of cabp2a in the bipolar cell layer. Scale bar: 50 µm. (F–H) Confocal images of the area selected in E. (F) In situ signal in bright field, (G) GFP signal localized in bipolar cells, (H) DAPI. Scale bar: 20 µm (I) Cross-section exhibiting in situ staining in the notochord. Scale bar: 100 µm. INL: inner nuclear layer, NC: notochord. EXPRESSION / LABELING:
|
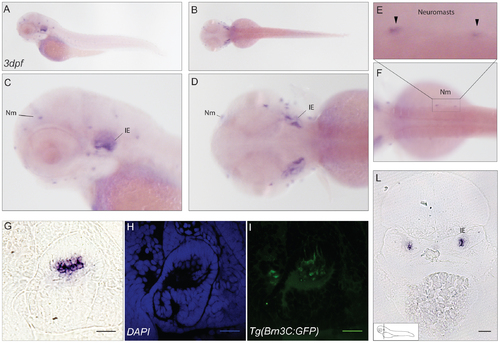
Expression pattern of cabp2b. (A–D) In situ hybridisation signal of cabp2b in 3dpf zebrafish embryos. Lateral (A) and dorsal (B) views of the embryo with higher magnification (C–D). Staining is restricted to hair cells in the inner ear and to the neuromasts. (F) View of stained neuromasts in the lateral line and (E) higher magnification of the selected area; arrowheads in E show the neuromasts. (G–L) Transverse section of the ear in the Tg(Brn3C:memGFP) transgenic line. (L) Epifluorescence image, showing strong expression of cabp2b in a subset of cells in the inner ear. Scale bar: 100 µm. (G) Higher magnification picture. (H–I) Confocal images. (H) DAPI signal, (I) GFP staining in the same domain as cabp2b. Scale bar: 20 µm. Nm: neuromast, IE: inner ear. EXPRESSION / LABELING:
|

Expression pattern of cabp4b. (A–D) In situ localisation of cabp4b transcript in 5dpf larvae. Lateral (A–C) and dorsal views (B–D). A strong staining in the photoreceptor layer is detected. (E–F) Cross section of a retina (E) with zoom in to the photoreceptor layer (F). Scale bar: 20 µm. Pr: photoreceptors. EXPRESSION / LABELING:
|
Expression pattern of cabp5b. (A–D2) Cabp5b expression in 2dpf (A–D) and 5dpf (A2–D2) zebrafish embryos: lateral (A,C–A2,C2) and dorsal (B,D–B2,D2) views. An intense staining is present in the inner ear and in the notochord at both stages of development. In 5dpf embryos, in addition, a strong signal is detectable in the retinal inner nuclear layer. (E–H) Sections of the ear in Tg(Brn3C:memGFP) transgenic line embryos. Epifluorescence image of a sectioned ear (E) and confocal images (F–H) showing strong expression of cabp5b in a subset of cells in the inner ear. Picture in bright field (F), DAPI (G), GFP (H). Scale bar: 20 µm. (I–L) Cross-sections of a retina in the Tg(Vsx2:eGFP) transgenic line. Epifluorescence image of a sectioned retina (I) and magnification (J), showing cabp5b antisense probe signal in the bipolar cell layer. Scale bar: 50 µm. (K–L) Confocal images. GFP signal localized in bipolar cells (K), DAPI (L). Scale bar: 20 µm. Ov: otic vesicle, IE: inner ear, INL: inner nuclear layer. |
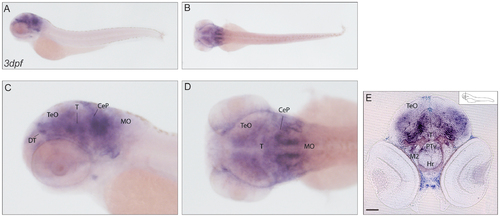
Expression pattern of cabp7a. (A–D) mRNA expression of cabp7a in lateral (A) and dorsal (B) views of 3dpf larvae with higher magnification (C–D). The signal of cabp7a antisense probe is widespread in the brain, with a stronger staining detected in the regions of the dorsal thalamus and the cerebellar plate. (E) Transverse section at the level of the eye, exhibiting diffuse expression of cabp7a in the developing brain. Scale bar: 100 µm. CeP: cerebellar plate; DT: dorsal thalamus; Hr: rostral hypothalamus; M2: migrated posterior tubercular area; MO: medulla oblongata; PTv: ventral part of posterior tuberculum; T: midbrain tegmentum; TeO: tectum opticum. EXPRESSION / LABELING:
|

Expression pattern of cabp7b. (A–D) In situ localisation of cabp7b transcript in 5dpf larvae. Lateral (A,C) and dorsal views (B, D). A wide distribution of cabp7b mRNA in the brain was observed. (E,F) Transverse sections. Strongly stained cells are present in the midbrain, probably in the region of the nucleus of medial longitudinal fascicle (E) and in the hindbrain area anterior to the medulla oblongata most likely at the level of the reticular formation(F). Scale bar: 50 µm. M2: migrated posterior tubercular area; MO: medulla oblongata; N: nucleus of medial longitudinal fascicle; RF: reticular formation; T: midbrain tegmentum; TeO: tectum opticum. EXPRESSION / LABELING:
|

Expression pattern of caln1. (A–D2) In situ signal of caln1 transcript in 2dpf (A–D) and 4dpf (A2–D2) larvae. Lateral (A,C–A2,C2) and dorsal views (B,D–B2D2). (E) Higher magnification shows specific staining in the dorsal spinal cord probably in Rohon Beard cells. (A2–D2) 4dpf whole mount embryos show diffuse signal in the brain and a specific expression in what is most probably the head of the pronephric ducts. (F) A transverse section through the retina shows expression in the retinal ganglion cell layer. Scale bar: 50 µm. SC neurons: spinal cord neurons, P: pallium; DT: dorsal thalamus; PD: pronephric duct; GCL: ganglion cell layer. |

Expression pattern of caln2. (A–D2) mRNA expression of caln2 in lateral (A,C–A2,C2) and dorsal (B,D–B2D2) views of 2dpf (A–D) and 4dpf (A2–D2) larvae with zoom in (C,D–C2,D2). The onset of caln1 expression takes place within the first two days of embryonic development. (A–D) At 2dpf the caln1 transcript localizes to the forebrain at the level of the subpallial region and in the caudal midbrain. (A-‘D’) The same expression profile seems to be maintained until day 4 of development. (E) Transverse section of the retina showing signal of caln1 antisense probe in a subset of retinal ganglion cells in the central part of the ganglion cell layer. Strongly stained cells are present in the region of the telencephalic pallial domain (F). Scale bar: 50 µm. P: pallium; DT: dorsal thalamus; T: midbrain tegmentum; GCL: ganglion cell layer; Sd: dorsal division of subpallium; Sv: ventral division of subpallium. |