
- Title
-
Activity-dependent competition regulates motor neuron axon pathfinding via PlexinA3
- Authors
- Plazas, P.V., Nicol, X., and Spitzer, N.C.
- Source
- Full text @ Proc. Natl. Acad. Sci. USA
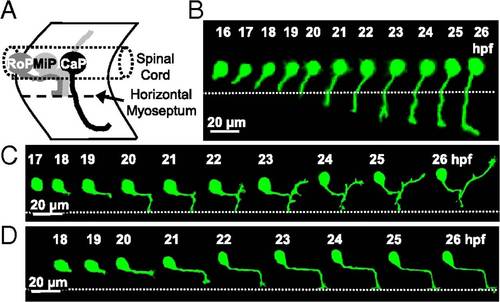
PMN axon pathfinding in the developing zebrafish embryo. (A) Schematic lateral view of the three PMN (CaP, MiP, and RoP) showing their axonal trajectories at 24 hpf. Anterior to the left and dorsal to the top. (B–D) Time-lapse analysis of axon outgrowth of a single CaP (B), MiP (C), or RoP (D) expressing eGFP in WT embryos. Each neuron was imaged at 20-min intervals for 10 h. The dotted line indicates the HMS. CaP is present at 16 hpf and begins to extend a process by 17 hpf. At 19 hpf, coincident with its arrival at the HMS, the CaP axon pauses, resuming its outgrowth by 21 hpf. MiP starts axonogenesis by 18 hpf and is followed by RoP at 19 hpf. n = 10 neurons of each class in 10 embryos. |
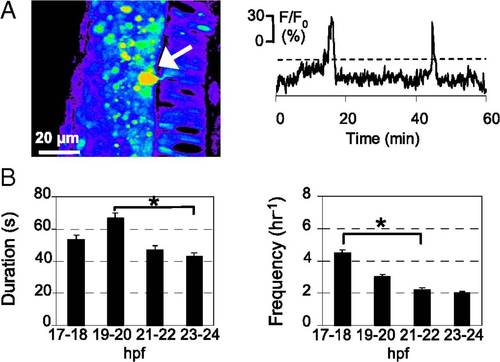
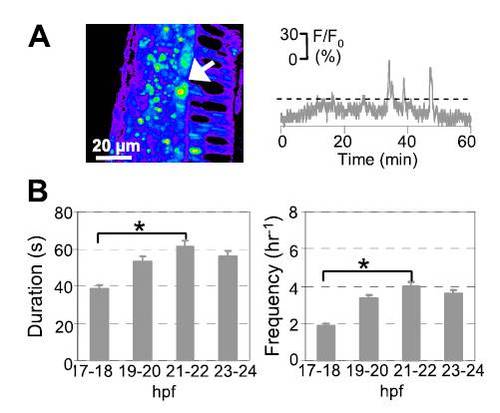
Developing PMN generate spontaneous intracellular Ca2+ waves. (A) PMN (arrow) loaded with CGD in the spinal cord of a zebrafish embryo at 20–21 hpf. Dorsal to the left and caudal at the bottom. Images were captured at 0.2 Hz for 30 min, and fluorescence intensity was normalized to baseline. Fluorescence is displayed on a pseudocolor scale, where purple represents the lowest intensity and red represents the highest intensity. Changes in fluorescence intensity in a PMN are plotted as a function of time. Ca2+ waves were identified as fluorescence transients greater than 20% of ΔF/F0 (dashed lines), more than two times the SD of the baseline, and >20 s in duration, calculated as the width at half-maximum. (B) Duration and frequency of Ca2+ waves in PMN. n = 15–20 neurons from seven to nine embryos for each time period; values are means ± SEM. *P < 0.05. |
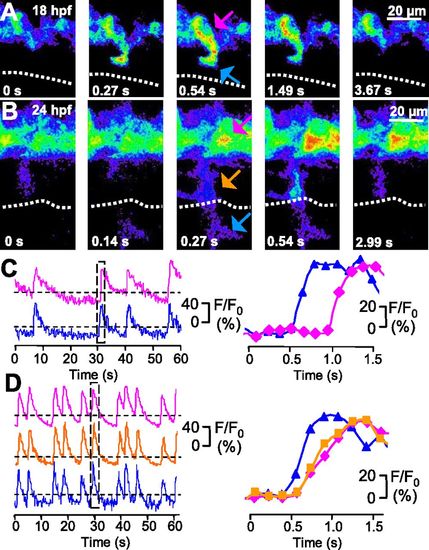
Ca2+ spikes are expressed both in the axon and soma of developing CaPs. (A and B) GCaMP3 activity acquired at 7.6 Hz in a single CaP of a single double-transgenic Hb9:Gal4/UAS:GCaMP3 embryo at 18 and 24 hpf. Dorsal is to the top and rostral is to the left. Fluorescence intensity is displayed on a pseudocolor scale like in Fig. 2. Dotted line indicates the HMS. (C and D) Time course of GCaMP3 activity in three regions (distal axon is blue, proximal axon is orange, and soma is magenta) from the same neuron. Intensity traces for regions identified by arrows are plotted as a function of time. The boxed regions in C Left and D Left are plotted in C Right and D Right, respectively. Fluorescence intensity was normalized to baseline. Dashed lines are the same as in Fig. 3. n = 50 spikes from 12 embryos (18 hpf), and n = 50 spikes from 5 embryos (24 hpf). EXPRESSION / LABELING:
|
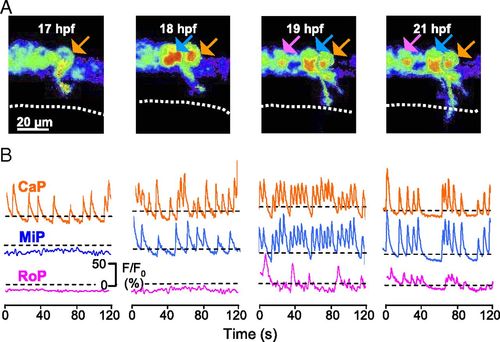
Ca2+ spiking activity is expressed sequentially in CaP, MiP, and RoP and then becomes synchronized. (A) GCaMP3 activity acquired at 4 Hz in three neurons (arrows; CaP is in orange, MiP is in blue, and RoP is in magenta) in a single double-transgenic Hb9:Gal4/UAS:GCaMP3 embryo imaged through consecutive time-lapse movies from 17 to 21 hpf. Dorsal is to the top and rostral is to the left. Fluorescence intensity is displayed as in Fig. 2. Dotted line identifies the HMS. (B) Intensities for selected regions are plotted as a function of time. Dashed lines are the same as in Fig. 3. n = 6 CaP, MiP, and RoP neurons from six embryos. EXPRESSION / LABELING:
|
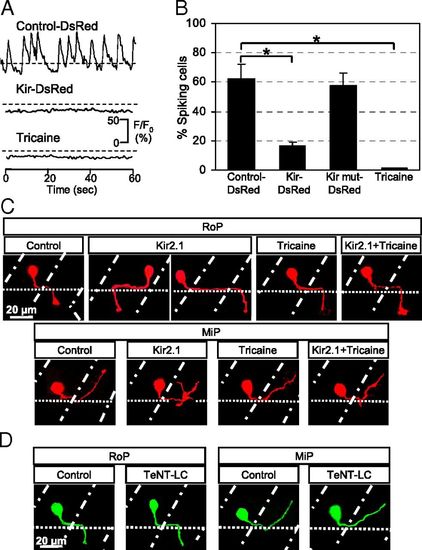
Suppression of Ca2+ spiking activity in single PMN leads to errors in axon pathfinding. (A) Ca2+ spikes are blocked by stochastic expression of hKir2.1 or exposure to 0.02% tricaine for 15 min. n = 20 for each condition. (B) Percentage of PMN exhibiting Ca2+ spiking activity at 19 hpf. n = 20 for each group; values are means ± SEM. *P < 0.0005 compared with control. (C) RoP and MiP neurons expressing hKir2.1 bypass the exit point or project rostrally and exhibit extra branching. Neither tricaine nor Kir2.1 + tricaine leads to errors in axon pathfinding. Control, embryos injected with Hb9:Gal4 and UAS:DsRed plasmids; Kir2.1, embryos injected with Hb9:Gal4 and UAS:DsRed::UAS:hKir2.1 plasmids; Tricaine, embryos raised in the presence of 0.02% tricaine; Kir2.1 + Tricaine, embryos expressing hKir2.1 and raised in the presence of tricaine. (D) Tetanus toxin expression does not cause pathfinding errors. Control, embryos injected with Hb9:Gal4 and UAS:eGFP plasmids; TeNT-LC, embryos injected with Hb9:Gal4 and UAS:TeNT-LC:eGFP plasmids. (C and D) Dorsal is to the top and rostral is to the left. Dot-dash lines mark lateral edges of the myotomes; dotted lines mark the ventral edge of the spinal cord. n ≥ 30 cells from ≥30 24-hpf embryos for each group. |
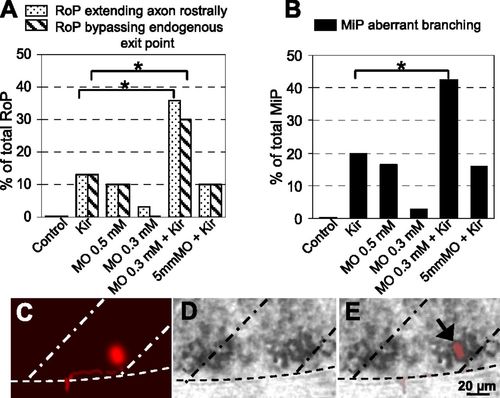
Synergistic interaction of hKir2.1 and PlexinA3. Percentage of (A) RoPs extending their axons rostrally or bypassing the endogenous exit point or (B) MiP axons with aberrant branching, including data from Fig. 6. Combination of a subthreshold concentration of PlexinA3 MO and hKir2.1 expression generates an increase in the incidence of pathfinding errors. Control, embryos injected with Hb9:Gal4 and UAS:DsRed plasmids; Kir, embryos injected with Hb9:Gal4 and UAS:DsRed::UAS:hKir2.1 plasmids; MO 0.5 mM, embryos injected with 0.5 mM PlexinA3 MO and Hb9:Gal4 and UAS:DsRed plasmids; MO 0.3 mM, embryos injected with 0.3 mM PlexinA3 MO and Hb9:Gal4 and UAS:DsRed plasmids; MO 0.3 mM + Kir, embryos injected with 0.3 mM PlexinA3 MO and Hb9:Gal4 and UAS:DsRed::UAS:hKir2.1 plasmids; 5 mm MO + Kir, embryos injected with 0.3 mM MO with five mismatched bases based on PlexinA3 MO and Hb9:Gal4 and UAS:DsRed::UAS:hKir2.1 plasmids. n = 30–40 neurons from e30 24-hpf embryos for each condition. *P < 0.05 using a Fisher exact test comparing PlexinA3 MO + Kir-injected with Kir-injected alone. (C–E) Single PMN expressing hKir2.1 and DsRed and exhibiting a pathfinding error expresses PlexinA3 mRNA. (C) A DsRed immunopositive RoP extending its axon rostrally. (D) In situ hybridization shows strong expression of PlexinA3 mRNA. (E) Merge of C and D. Dorsal is to the top and rostral is to the left. Dot-dash lines mark lateral edges of the myotomes; dotted lines mark the ventral edge of the spinal cord. n = 4 MiPs, and n = 4 RoPs. PHENOTYPE:
|
Developing spinal secondary motor neurons (SMN) generate spontaneous intracellular Ca2+ waves. (A) A SMN (arrow) loaded with calcium green-1 dextran in the spinal cord of a zebrafish embryo at 20–21 hpf. Dorsal is to the left and caudal is at the bottom. Images were captured at 0.2 Hz for 30 min, and fluorescence intensity was normalized to baseline. Fluorescence is displayed on a pseudocolor scale, where purple represents the lowest intensity and red represents the highest intensity. Changes in fluorescence intensity in a SMN are plotted as a function of time. Ca2+ waves were identified as fluorescence transients greater than 20% of ΔF/F0 (dashed lines), more than two times the SD of the baseline, and >20 s in duration, calculated as the width at half-maximum. (B) Duration and frequency of Ca2+ waves in SMN. n = 15–20 neurons from seven to nine embryos for each time period; values are means ± SEM. *P < 0.05. |