
- Title
-
Regional Cell Shape Changes Control Form and Function of Kupffer's Vesicle in the Zebrafish Embryo
- Authors
- Wang, G., Manning, M.L., and Amack, J.D.
- Source
- Full text @ Dev. Biol.
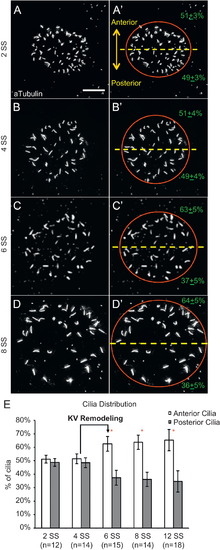
Distribution of motile cilia becomes asymmetric along the anterior–posterior (AP) axis during Kupffer′s vesicle development. (A–D) Immunostaining of cilia in Kupffer′s vesicle (KV) with acetylated Tubulin antibodies at different somite stages (SS). (A′–D′) Red circle approximates the KV lumen boundary. The dashed yellow line bisects KV into anterior and posterior regions. All images are oriented with anterior at the top and posterior at the bottom. KV cilia were equally distributed between the anterior and posterior regions at 2 SS (A, A′) and 4 SS (B, B′). In contrast, However at 6 SS (C, C′) and 8 SS (D, D′), cilia were asymmetrically distributed. The average cilia distribution is presented ± one standard deviation (in green). Scale bar=10 μm. (E) The percentage of cilia in anterior and posterior regions of KV at different stages of development. Error bars=one standard deviation. n=number of embryos analyzed. *Significant difference between anterior and posterior (p<0.0001). |
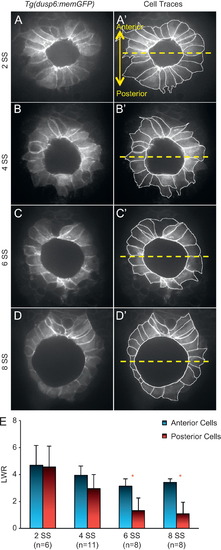
Ciliated KV cells undergo region-specific cell shape changes during morphogenesis. (A–D) Optical cross-sections through the middle focal plane of KV cells expressing membrane-localized GFP in wild-type Tg(dusp6:memGFP) embryos at different stages of development. (A′–D′) KV cell boundaries were outlined to highlight cell shapes. The dashed yellow line bisects KV into anterior and posterior regions. All images are oriented with anterior at the top and posterior at the bottom. (E) Length-to-width ratio (LWR) of anterior and posterior cells at different stages of development. Error bars=one standard deviation. n=number of embryos analyzed. * Significant difference between anterior and posterior (p<0.01). |
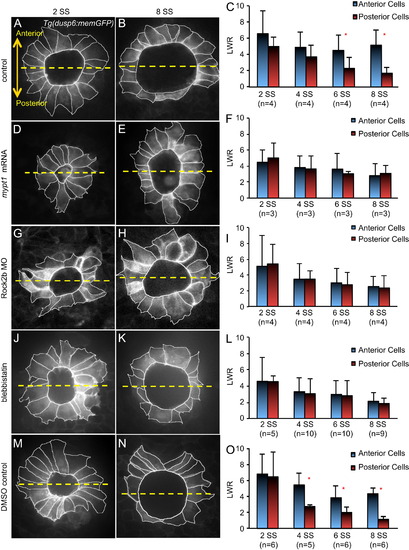
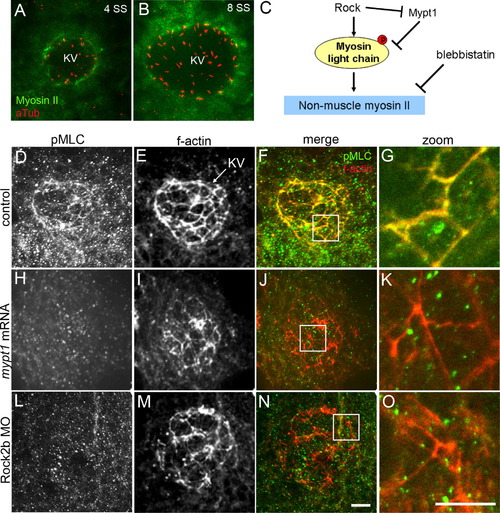
Interfering with Myosin II Activity via Mypt1 over-expression, Rock2b knockdown or blebbistatin treatment disrupts KV cell shape changes. (A, B, D, E, G, H, J, K, M and N) Images of outlined KV cells in Tg(dusp6:memGFP) embryos at 2 SS (A, D, G, J, and M) or 8 SS (B, E, H, K and N) treated with control MO (A and B), mypt1 mRNA (D and E) Rock2b MO (G and H), blebbistatin (J and K) or DMSO (M and N). The dashed yellow line bisects KV into anterior and posterior regions. Images are oriented with anterior at the top and posterior at the bottom. (C, F, I, L and O) Average length-to-width ratios (LWR) of anterior and posterior cells at different stages of KV morphogenesis in treated embryos. Error bars=one standard deviation. n=number of embryos analyzed. * Significant difference between anterior and posterior (p<0.01). |
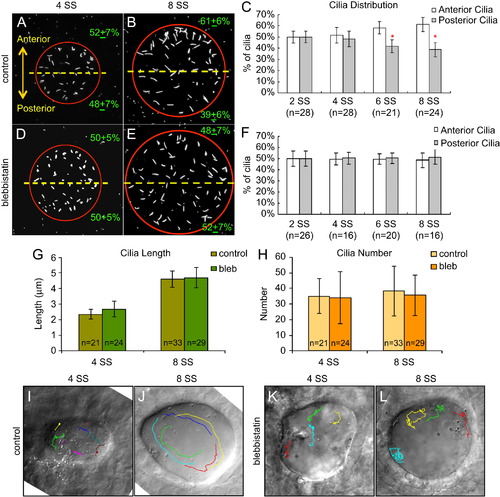
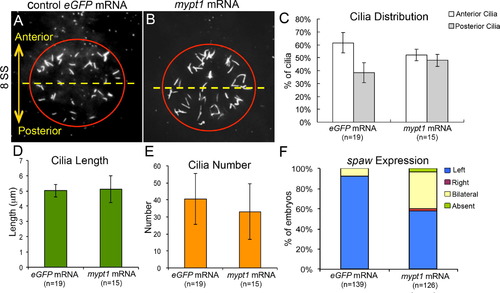
Blebbistatin disrupts asymmetric cilia distribution and directional fluid flow in KV. (A, B, D and E) Immnostaining of KV cilia in control DMSO treated (A and B) and blebbistatin treated (D and E) embryos at 4 SS and 8 SS. (C and F) Analysis of cilia distribution in DMSO control (C) and blebbistatin (F) treated embryos during KV development. Error bars=one standard deviation. n=number of embryos analyzed. *Significant difference between anterior and posterior (p<0.0001). (G and H) KV cilia length (G) and number (H) was similar in control and blebbistatin treated embryos at 4 SS and 8 SS. Error bars=one standard deviation. n=number of embryos analyzed. (I–L) Visualization of fluid flow by superimposing tracks of bead movement on an image of KV (see Movies S4–S7). Control DMSO treated embryos displayed uncoordinated flow at 4 SS (I), but strong counter-clockwise flow at 8 SS (J). In blebbistatin treated embryos, directional flow was not observed at 4 SS (K) or 8 SS (L). |
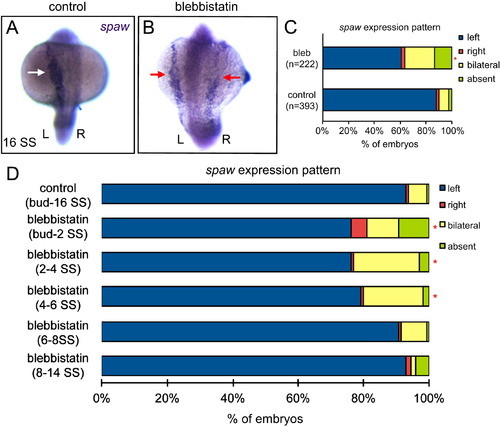
Blebbistatin treatment during early KV development stages disrupts LR patterning. (A and B) RNA in situ hybridizations show normal left-sided spaw expression (arrows) at 16 SS in a control embryo treated with DMSO (A) and bilaterally symmetric spaw expression in a blebbistatin treated embryo (B). (C) spaw expression was significantly altered in embryos treated with blebbistatin between 1–8 SS relative to DMSO controls. (D) Anlaysis of spaw expression in DMSO controls and embryos treated with blebbistatin during the stages indicated. n>100 embryos for all treatments. *Significantly different from controls (p<0.05). |

|
|
|

|
Reprinted from Developmental Biology, 370(1), Wang, G., Manning, M.L., and Amack, J.D., Regional Cell Shape Changes Control Form and Function of Kupffer's Vesicle in the Zebrafish Embryo, 52-62, Copyright (2012) with permission from Elsevier. Full text @ Dev. Biol.