
- Title
-
ALDH2 Mediates 5-Nitrofuran Activity in Multiple Species
- Authors
- Zhou, L., Ishizaki, H., Spitzer, M., Taylor, K.L., Temperley, N.D., Johnson, S.L., Brear, P., Gautier, P., Zeng, Z., Mitchell, A., Narayan, V., McNeil, E.M., Melton, D.W., Smith, T.K., Tyers, M., Westwood, N.J., and Patton, E.E.
- Source
- Full text @ Chem. Biol.
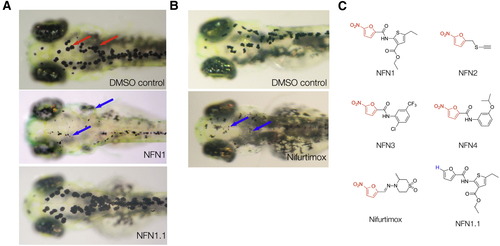
5-Nitrofurans Promote Melanocytotoxicity in Zebrafish (A and B) Examples of zebrafish embryos treated at 2 dpf for 48 hr with DMSO as a control, plus 5 μM NFN1 and 5 μM NFN1.1 (A) or 50 μM nifurtimox (B). Black melanocytes (red arrows) and melanocyte detritus (blue arrows) are indicated. (C) Chemical structures of the four 5-nitrofurans (NFN1–4 [Maybridge compounds BTB05727, SEW00138, BTB13657, and BR00087]) identified in a chemical screen for modulators of melanocyte development. The 5-NO2-furan functional group shared between the 5-nitrofurans, including nifurtimox, is indicated in red. The chemical structure of NFN1.1. is identical to that of NFN1 but lacks the 5-NO2 functional group required for activity (blue). See also Figur S1 and Movie S1. |
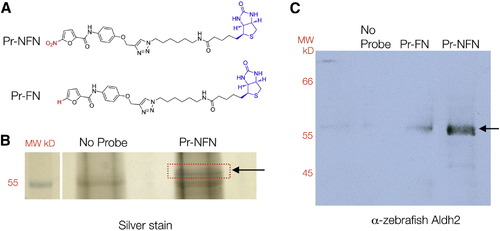
5-Nitrofurans Bind Aldh2 in Zebrafish (A) Biotinylated probes linked to a 5-nitrofuran (Pr-NFN) and a control furan (Pr-FN). Biotin is labeled in blue and the 5-nitro or modification moiety in red. (B) Silver stain of protein bands identified using Pr-NFN probe, or streptavidin beads alone as a control (No Probe). The red box indicates the region of the gel that was isolated for mass spectrometry analysis (arrow) at 57 kD. (C) Western blot of zebrafish protein bound to the no-probe control, the furan (Pr-FN) control, or the 5-nitrofuran probe (Pr-NFN), and probed with zebrafish anti-Aldh2 antibodies. A band corresponding to 57 kDa is indicated (arrow). MW, molecular weight. See also Figure S2 and Table S1. EXPRESSION / LABELING:
|
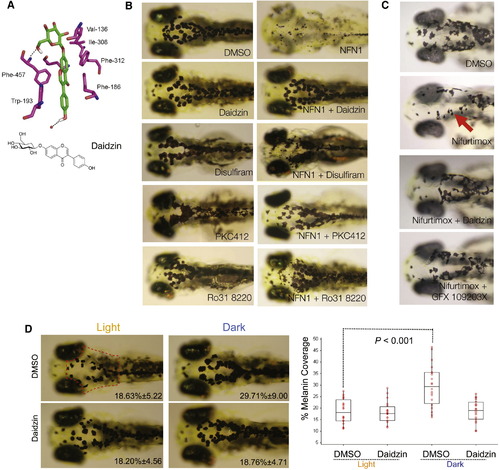
Aldh2 Is Responsible for 5-Nitrofuran Activity in Zebrafish (A) A predicted model of daidzin binding to zebrafish ALDH2b, based on key residues involved in the human ALDH2-daidzin (PDB 2vle) protein-ligand interaction (Lowe et al., 2008). The equivalent residues in zebrafish Aldh2b are shown. Human ALDH2′Zebrafish Aldh2 2b (Phe-459′Phe-457; Phe-170′Phe-186; Trp-177′Trp-193; Val-120′Val-136; Phe-296′Phe-312; Phe-292′Ile-308; Asp-457′Asn-473; Cys-303′Cys-319). (B) Aldh2 and PKC inhibitors prevent 5-nitrofuran activity in zebrafish. Examples of zebrafish embryos treated at 2 dpf with 20 μM of the ALDH inhibitors daidzin or DSF for 1 hr, or with 20 μM of the PKC inhibitors PKC412 or Ro318220, and then treated with 5 μM NFN1 or 0.1% DMSO alone for 2 days. Experiments were repeated at least three times, with n > 10 embryos per condition. (C) Examples of 2 dpf zebrafish embryos pretreated with DMSO, 30 μM of daidzin, or the PKC inhibitor GFX 109203X for 1 hr, and then treated with 50 μM nifurtimox for 7 hr. Punctate melanocytes are indicated. Experiments were repeated at least three times (n = 5-10 embryos per condition) and treatment-condition cohorts blind scored. (D) Daidzin alters background adaptation in zebrafish embryos. (Left) Images of fixed zebrafish embryos (5 dpf) treated with 0.1% DMSO or 10 μM daidzin, and shifted from a dark environment to a light environment (light), or vice versa (dark). The average percentage of melanin coverage (within the area indicated by the red dotted outline) for each treatment condition ± SD is indicated. (Right) Box plot of melanin coverage (y axis) for each embryo in different treatment conditions (x axis). Individual values taken from one of three experiments are shown as red circles. The box depicts the lower quartile and the upper quartile, with the median depicted by the intersecting line. Whiskers extend between the minimum and maximum of all the data. In DMSO-treated embryos, melanocytes are significantly contracted in the light and expanded in the dark (p < 0.001, n = 20 for each condition; ANOVA, 95% confidence interval [CI] 11.081[5.966, 16.195]). Zebrafish treated with daidzin contract their melanin in response to light environment but do not significantly expand their melanin in response to dark environments (95% CI 0.563[4.552, 5.677]). The experiment was repeated three separate times with embryos at 5 dpf (n = 5-20 embryos per condition) and once with embryos at 4 dpf (n = 10 embryos per condition). See also Figure S3. |
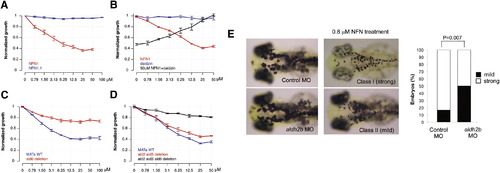
Cross-Species Conservation of 5-Nitrofuran-ALDH2 Interaction in Yeast (A) Yeast cultures were treated with NFN1 (red) or NFN1.1 (blue). OD values were normalized against DMSO-treated controls. The mean of two experiments with three replicates is shown; error bars represent the SE. (B) Daidzin-NFN1 drug interaction was assessed by combination matrix assays in 96 well plates. Cultures were treated with NFN1 (red) or with daidzin in the absence (blue) or presence (black) of 50 μM NFN1. The average normalized growth of three experiments is shown; error bars represent the SE. (C) Normalized growth in the presence of NFN1 was determined for wild-type (blue) and the Δald6 strain (red). Data points are the mean of four replicates; error bars represent the SE. (D) NFN1 dose response curves for Δald2Δald3 (red) and the Δald2Δald3Δald6 (black) strains, as well as wild-type control (blue), were generated and normalized against DMSO-treated controls. The average of three replicates is shown; error bars represent the SE. (E) Control (n = 24) or aldh2b splice-site morphants (n = 62) at 3 dpf without NFN1 treatment (left) or with 0.8 μM NFN1 treatment (right). Embryos were scored as class I (strong) or class II (mild) sensitivity to NFN1 (bar graph). aldh2b morphant embryos were less sensitive to NFN1 treatment compared to control morphants (p = 0.007; 95% CI [0.139, 0.528]; Fisher’s exact test). See also Figure S4 |
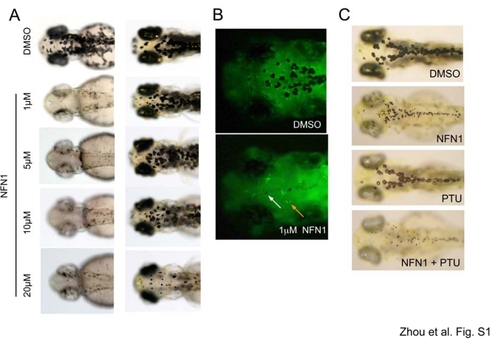
Melanocyte sensitivity to NFN1 treatment. A. Example images of zebrafish following increasing concentrations of NFN1 (left panel), and transfer to fresh E3 embryo medium (washout) for three days. B. Melanocytes are visible in transgenic zebrafish embryos expressing melanocyte specific tryp1-GFP both by the black pigment and GFP poistive cytoplasm. In NFN1 treated embryos most melanocytes are no longer visible, and black detritus is not associated with GFP positive cytoplasm (white arrow), although a few melanocytes survive (orange arrow). C. PTU does not rescue NFN1 activity in melanocytes. PTU inhibits the activity of tyrosinase, the rate-limiting enzyme required for pigment synthesis. Two dpf zebrafish embryos were pre-treated with 30mg/l PTU for 6 hours, and then treated with 0.5 μM NFN1 or DMSO as a control. |
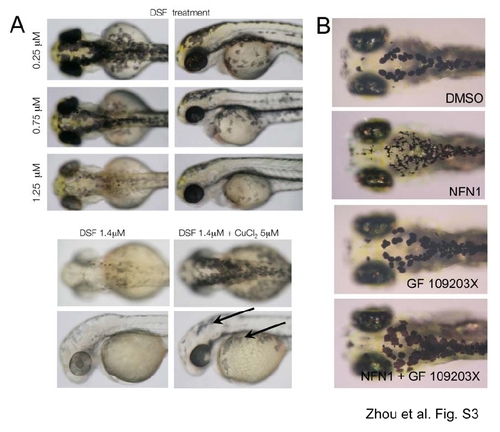
Chemical control of the ALDH2-PKC pathway in zebrafish . A. Two-day old embryos treated with low doses of DSF maintain pigmentation (top panels). Loss of pigmentation in DSF treated embryos can be restored with copper (lower panels). Pigmented melanocytes are indicated (arrow). B. The PKC inhibitor, GF 109203X prevents NFN1-induced phenotypes. Zebrafish embryos grown at 28.5°C for 2 days and treated with NFN1 for 24 hours in the presence of DMSO, NFN1, GF 109203X (Enzo Life Sciences, UK) or NFN1 and GF 109203X (n=40). Co-treatment with 20μM GF 109203X prevented NFN1 activity in 35/40 treated embryos. Experiments were repeated four times. C. Daidzin alters background adaptation in zebrafish embryos. (Left) Images of fixed zebrafish embryos (5 dpf) treated with 0.1% DMSO or 10 μM daidzin, and shifted from a dark environment to a light environment (light), or vice versa (dark). The average percentage of melanin coverage (within the area indicated by red dotted outline) for each treatment condition ± standard deviation is indicated. (Right) Box plot of melanin coverage (y-axis) for each embryo in different treatment conditions (x-axis). Individual values taken from one of three experiments are shown as red circles. The box depicts the lower quartile and the upper quartile, with the median depicted by the intersecting line. Whiskers extend between the minimum and maximum of all the data. In DMSO treated embryos, melanocytes are significantly contracted in the light and expanded in the dark (P<0.001, n=20 for each condition); one-way analysis of variance (ANOVA), [mean and 95% confidence interval of differences; 11.081(5.966,16.195)]. Zebrafish treated with daidzin contract their melanin in response to light environment, but do not significantly expand their melanin in response to dark environments [95% CI 0.563(-4.552, 5.677)]. The experiment was repeated three separate times with embryos at 5 dpf (n=5-20 embryos per condition) and once at 4 dpf (n= 10 embryos per condition). |