
|
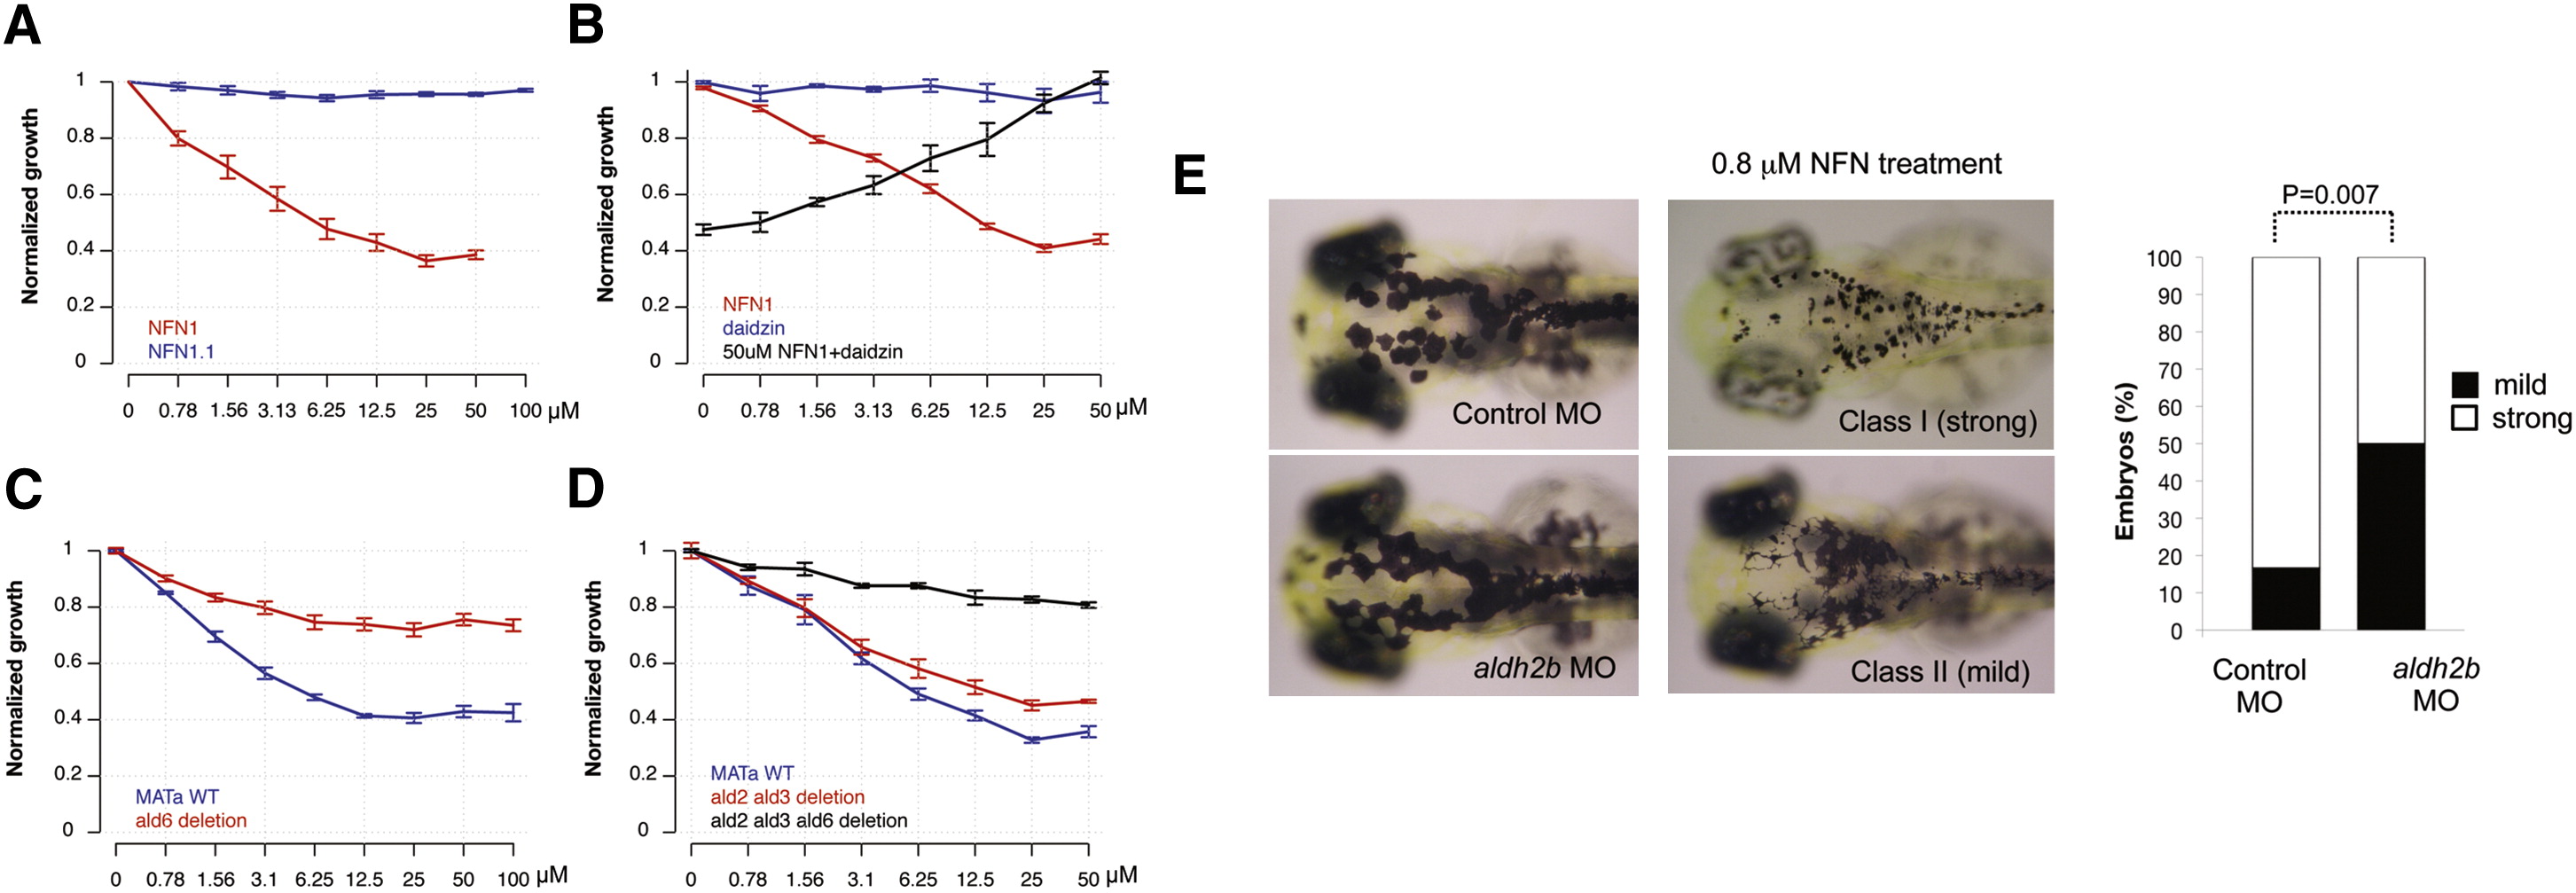
Fig. 4
Cross-Species Conservation of 5-Nitrofuran-ALDH2 Interaction in Yeast (A) Yeast cultures were treated with NFN1 (red) or NFN1.1 (blue). OD values were normalized against DMSO-treated controls. The mean of two experiments with three replicates is shown; error bars represent the SE. (B) Daidzin-NFN1 drug interaction was assessed by combination matrix assays in 96 well plates. Cultures were treated with NFN1 (red) or with daidzin in the absence (blue) or presence (black) of 50 μM NFN1. The average normalized growth of three experiments is shown; error bars represent the SE. (C) Normalized growth in the presence of NFN1 was determined for wild-type (blue) and the Δald6 strain (red). Data points are the mean of four replicates; error bars represent the SE. (D) NFN1 dose response curves for Δald2Δald3 (red) and the Δald2Δald3Δald6 (black) strains, as well as wild-type control (blue), were generated and normalized against DMSO-treated controls. The average of three replicates is shown; error bars represent the SE. (E) Control (n = 24) or aldh2b splice-site morphants (n = 62) at 3 dpf without NFN1 treatment (left) or with 0.8 μM NFN1 treatment (right). Embryos were scored as class I (strong) or class II (mild) sensitivity to NFN1 (bar graph). aldh2b morphant embryos were less sensitive to NFN1 treatment compared to control morphants (p = 0.007; 95% CI [0.139, 0.528]; Fisher’s exact test). See also Figure S4