
- Title
-
The Neutrophil's Eye-View: Inference and Visualisation of the Chemoattractant Field Driving Cell Chemotaxis In Vivo
- Authors
- Kadirkamanathan, V., Anderson, S.R., Billings, S.A., Zhang, X., Holmes, G.R., Reyes-Aldasoro, C.C., Elks, P.M., and Renshaw, S.A.
- Source
- Full text @ PLoS One
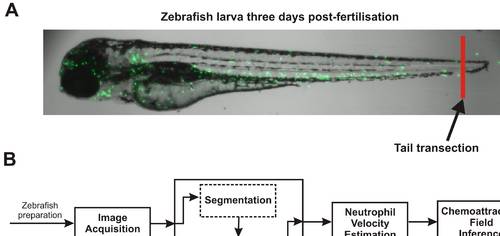
Zebrafish experimental setup and neutrophil analysis procedure. A: Zebrafish larva from the transgenic line, Tg(mpx:GFP)i114. Neutrophils are visualised by excitation of green fluorescent protein, as previously described (Renshaw et al., 2006). The zebrafish were prepared by transection of the tailfin at the site indicated to elicit an inflammatory response, which caused recruitment of the neutrophils to the site of injury. B: The chemoattractant field inference framework. Firstly, images of neutrophil recruitment to the zebrafish wound site were acquired by video microscopy. The neutrophil centroid positions were then obtained from a segmentation and tracking algorithm. Velocities of the neutrophils were estimated from the neutrophil centroid tracks using a Kalman smoother and lastly, the velocity estimates were used in the inference of the chemoattractant field. EXPRESSION / LABELING:
|
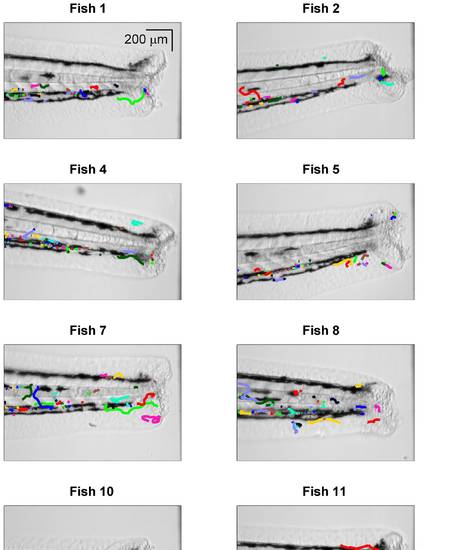
Neutrophil centroid position tracks. The neutrophil tracks (colour lines) were obtained from a segmentation and tracking algorithm and are shown here in relation to the zebrafish image (greyscale), where the zebrafish image of dimension 1000X1000 pixels has been zoomed on the vertical axis to the 100–900 pixel range. |
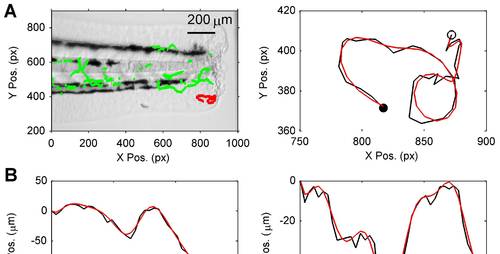
Typical examples of neutrophil tracks and neutrophil velocity estimates. A and D: The image on the left shows a highlighted red track that is zoomed in the plot on the right, in which the centroid positions extracted from the tracking algorithm (black) and smoothed track estimate (red) are compared (the open circle indicates the track start point and the filled circle indicates the track end point). B and E: X-Y cell centroid position estimates corresponding to tracks highlighted in A and B are shown as signals with respect to time produced by the tracking algorithm (black) and estimates from the smoothing algorithm (red). C and F: X-Y velocity estimates (raw estimates in black and smoothed estimates in red), corresponding to position signals in B and E. Raw estimates of velocity were obtained by numerical differencing (central difference method) applied to the tracker position estimates. |