
|
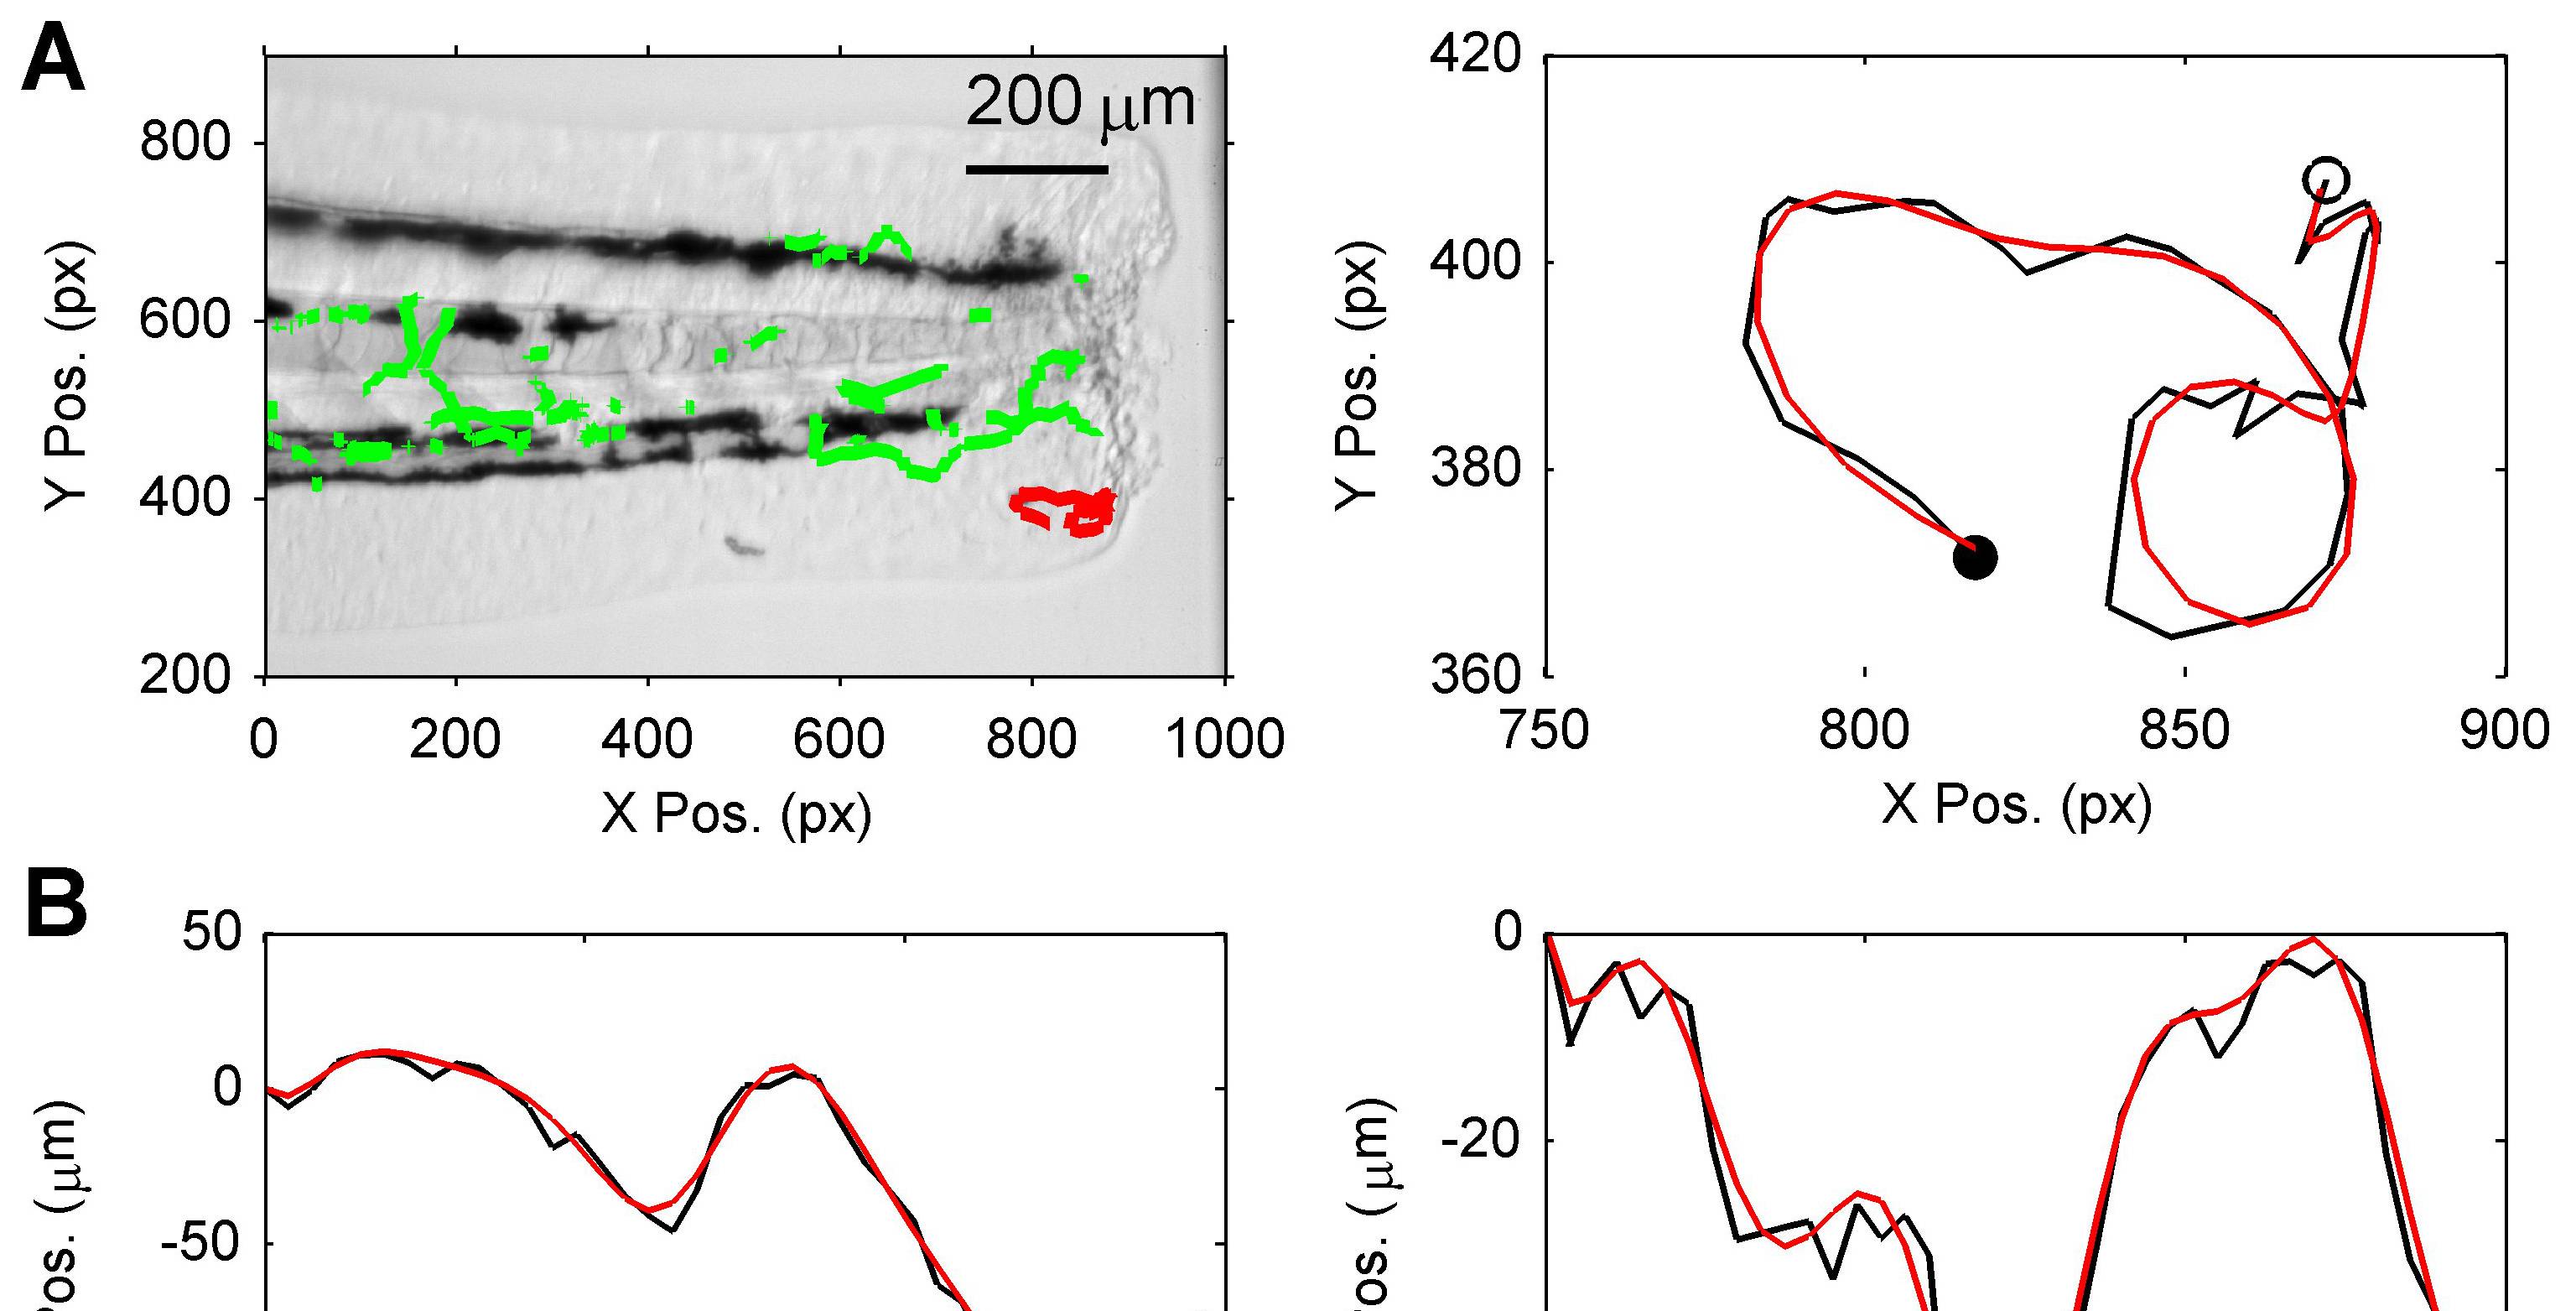
Fig. 3 Typical examples of neutrophil tracks and neutrophil velocity estimates.
A and D: The image on the left shows a highlighted red track that is zoomed in the plot on the right, in which the centroid positions extracted from the tracking algorithm (black) and smoothed track estimate (red) are compared (the open circle indicates the track start point and the filled circle indicates the track end point). B and E: X-Y cell centroid position estimates corresponding to tracks highlighted in A and B are shown as signals with respect to time produced by the tracking algorithm (black) and estimates from the smoothing algorithm (red). C and F: X-Y velocity estimates (raw estimates in black and smoothed estimates in red), corresponding to position signals in B and E. Raw estimates of velocity were obtained by numerical differencing (central difference method) applied to the tracker position estimates.