
|
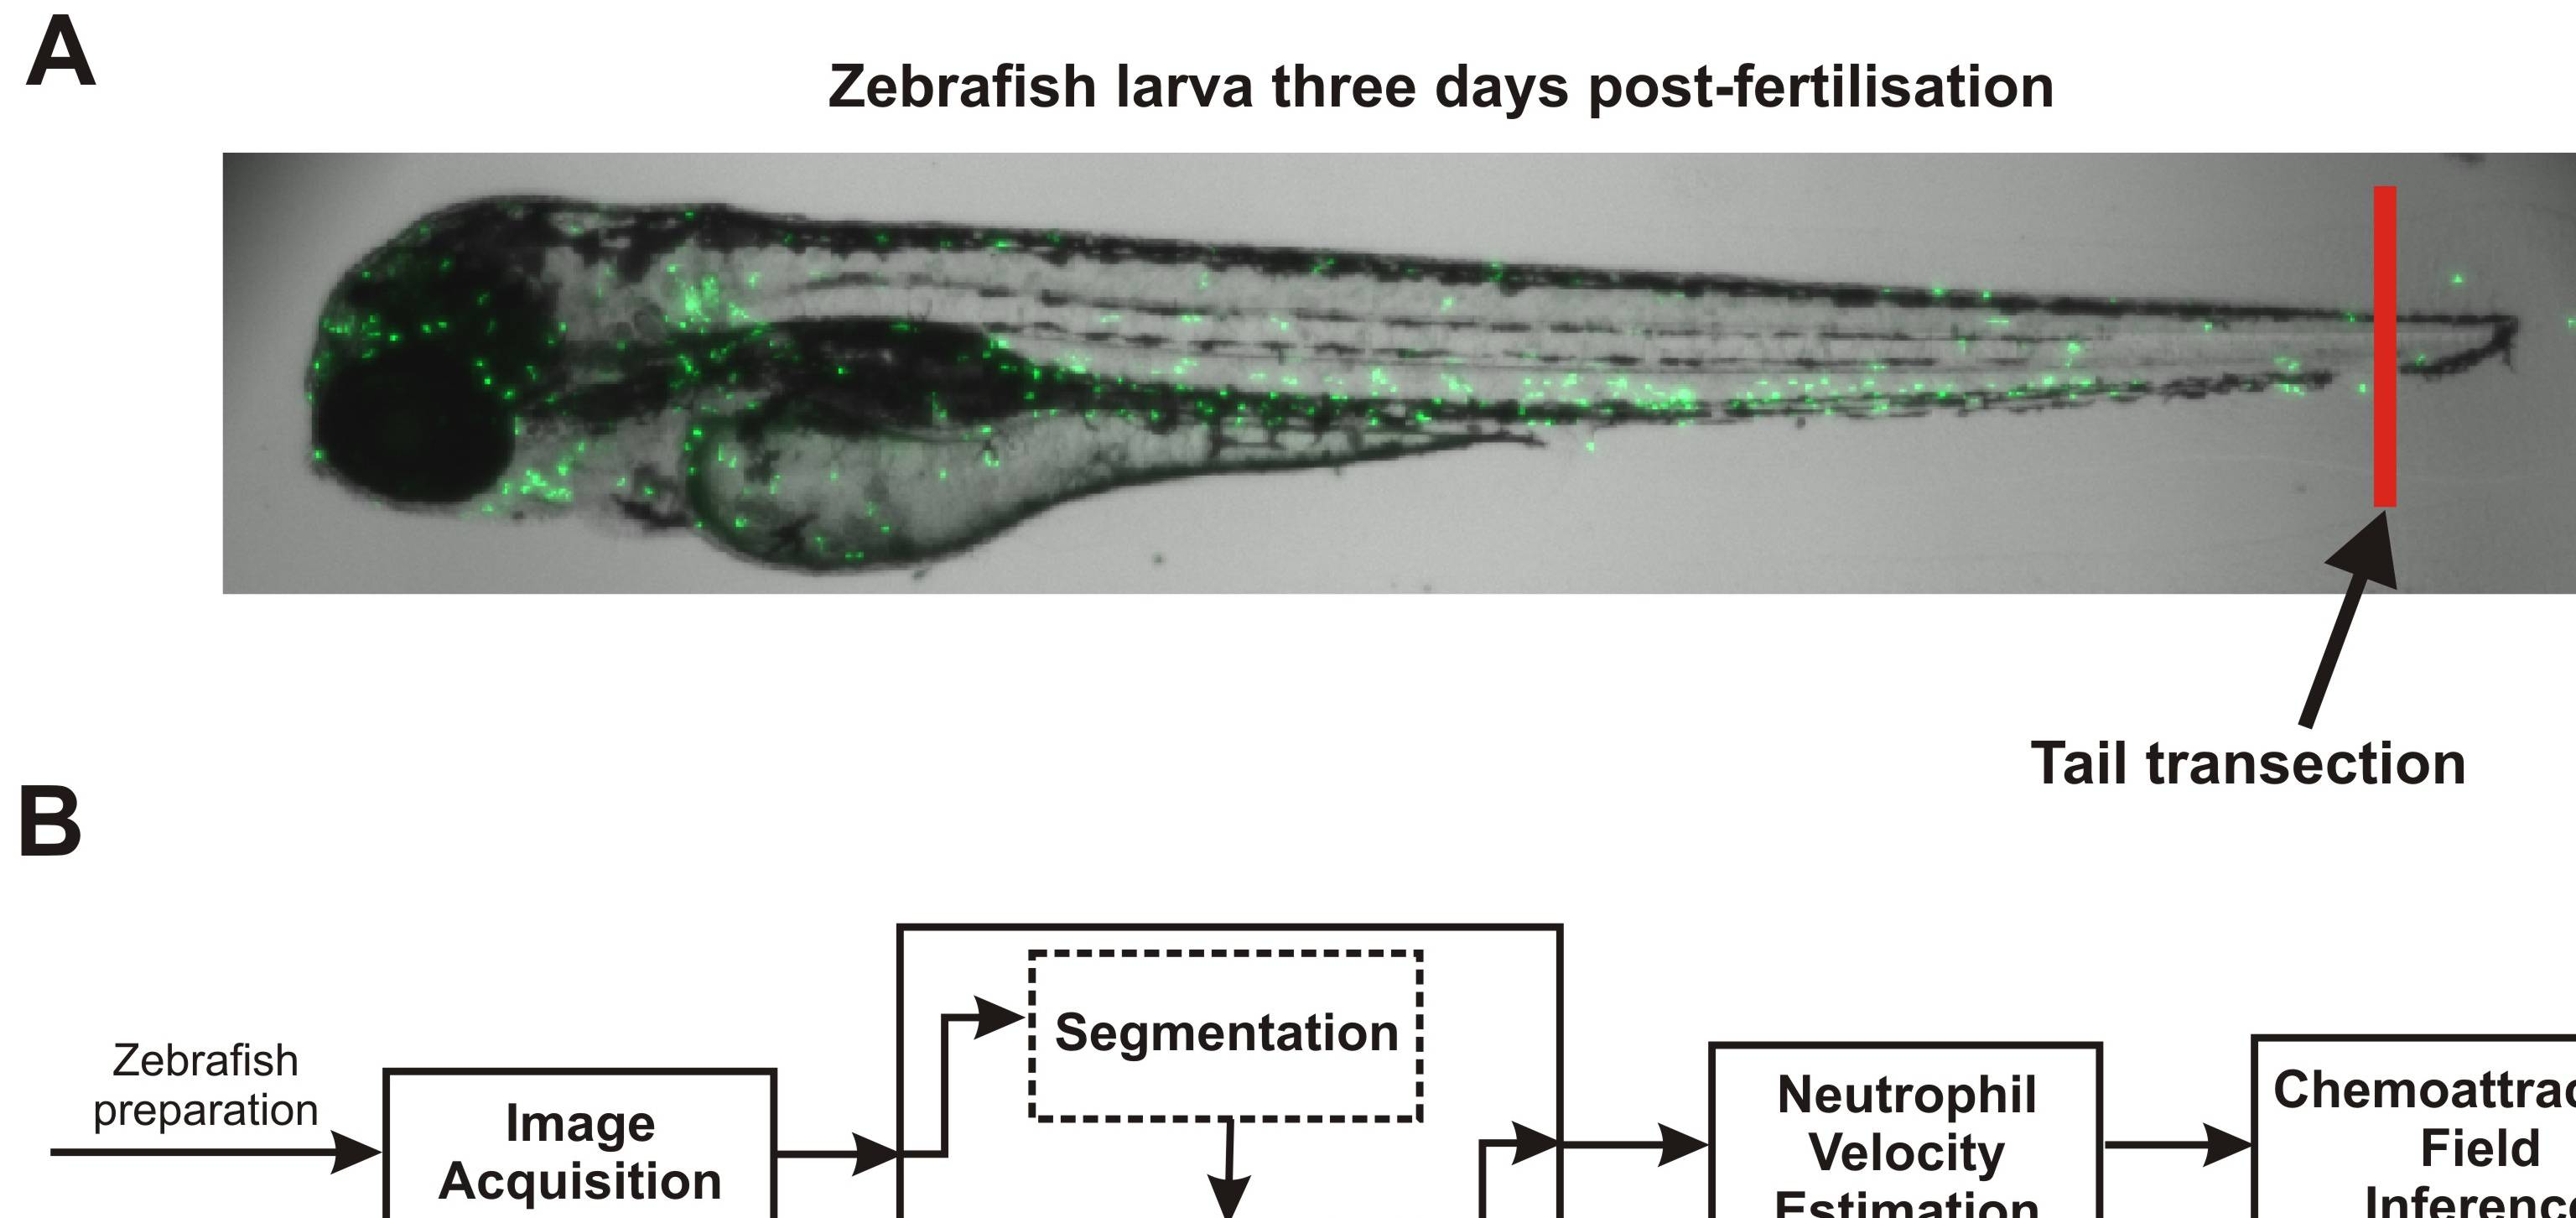
Fig. 1 Zebrafish experimental setup and neutrophil analysis procedure.
A: Zebrafish larva from the transgenic line, Tg(mpx:GFP)i114. Neutrophils are visualised by excitation of green fluorescent protein, as previously described (Renshaw et al., 2006). The zebrafish were prepared by transection of the tailfin at the site indicated to elicit an inflammatory response, which caused recruitment of the neutrophils to the site of injury. B: The chemoattractant field inference framework. Firstly, images of neutrophil recruitment to the zebrafish wound site were acquired by video microscopy. The neutrophil centroid positions were then obtained from a segmentation and tracking algorithm. Velocities of the neutrophils were estimated from the neutrophil centroid tracks using a Kalman smoother and lastly, the velocity estimates were used in the inference of the chemoattractant field.