
- Title
-
Limited dedifferentiation provides replacement tissue during zebrafish fin regeneration
- Authors
- Stewart, S., and Stankunas, K.
- Source
- Full text @ Dev. Biol.
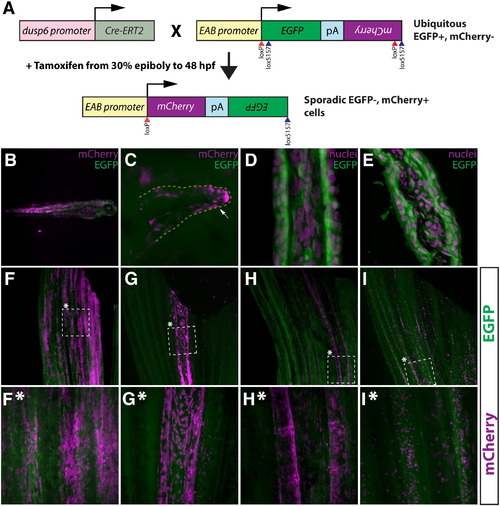
A tamoxifen-inducible Cre/lox method for mosaic cell labeling and lineage tracing in the adult zebrafish caudal fin. (A) Embryos carrying both dusp6:Cre-ERT2 and EAB:EGFP-FlEx-mCherry transgenes are briefly exposed to tamoxifen to sporadically induce rare genetic recombination events that permanently switch those cells and their descendants to mCherry from EGFP expression. (B, C) Whole mount epifluorescent images of 3 day old Tg(dusp6:Cre-ERT2, EAB:EGFP-FlEx-mCherry) fish that were treated with tamoxifen (1 μM) at 30% epiboly for 48 h. Mosaic mCherry+ cells (magenta) are observed in various tissues (B), including pectoral fin mesenchyme (C). The white arrow highlights mCherry+ cells. (D, E) The EAB:EGFP-FlEx-mCherry transgene is expressed in various cell lineages that make up the adult caudal fin. Longitudinal (D) and transverse (E) sections of adult caudal fins of Tg(EAB:EGFP-FlEx-mCherry) animals. EGFP expressing cells (green) were are stained with Hoechst to visualize nuclei (magenta). (F–I, F*–I*) Tg(dusp6:Cre-ERT2, EAB:EGFP-FlEx-mCherry) adult animals, treated as above, exhibit spatially restricted mCherry+ mosaics in four distinct classes. The dashed box marked with an asterisk represents the region shown at higher magnification in the panels directly below (F*–I*). (F and F*) Class 1 epidermal mosaics. (G and G*) Class 2 fibroblast mosaics. (H and H*) Class 3 osteoblast mosaics. (I and I*) Class 4 putative macrophage mosaics. In each panel (F-I*), the expression of EGFP (green) and mCherry (magenta) is shown. The top and bottom of each panel correspond to the distal and proximal regions of the fin, respectively. |
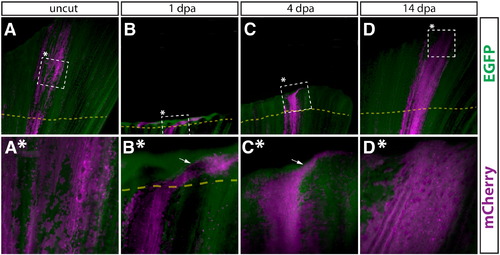
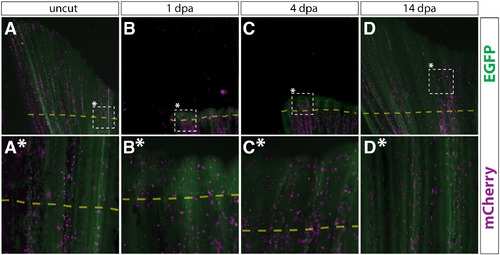
Newly regenerated epidermis is derived from pre-existing epidermal cells. (A–D, A*–D*) Whole mount epifluorescent images from the caudal fin from a Tg(dusp6:Cre-ERT2, EAB:EGFP-FlEx-mCherry) animal containing Class 1 labeled epidermal cells before amputation (A, A*), 1 dpa (B, B*), 4 dpa (C, C*), and 14 dpa (D, D*). Dashed boxes marked with an asterisk represent the region shown at higher magnification in the panel directly below. (A–D) and (A*–D*) are images acquired at 25 × and 120 × magnifications, respectively. EGFP+ cells are in green and mCherry+ cells are pseudocolored magenta. The top and bottom of each panel correspond to the distal and proximal regions of the fin, respectively. The dashed yellow line shows the approximate amputation site and the white arrows point to epidermal cells found laterally to the starting population. |
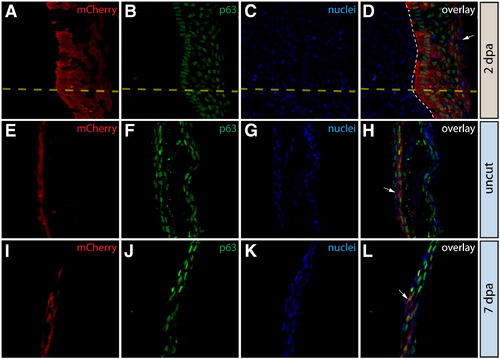
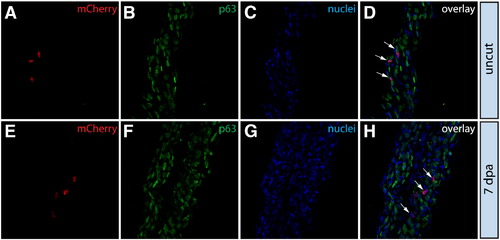
Epidermal cells do not contribute to the blastema or change fate during regeneration. (A–L) Longitudinal sections of the caudal fin of Tg(dusp6:Cre-ERT2, EAB:EGFP-FlEx-mCherry) Class 1 mosaic animals demonstrating mCherry expression (red, A, E, I) and stained with anti-p63 antibodies to mark epidermal cells (green, B, F, J) and with Hoechst to mark nuclei (blue, C, G, K). The three-color overlays are shown in (D, H, L). (A–D) mCherry+ epidermal cells in Tg(dusp6:Cre-ERT2, EAB:EGFP-FlEx-mCherry) Class 1 mosaic animals remain positive for the epidermal maker p63 at 2 dpa. The yellow dashed line marks the approximate amputation site and the white dashed line marks the boundary between the epidermis and the blastema. (E–L) Stained fin sections from the same Tg(dusp6:Cre-ERT2, EAB:EGFP-FlEx-mCherry) Class 1 mosaic animal prior to amputation (E–H) and 7 dpa (I–L). White arrows indicate mCherry+/p63+ epidermis. |
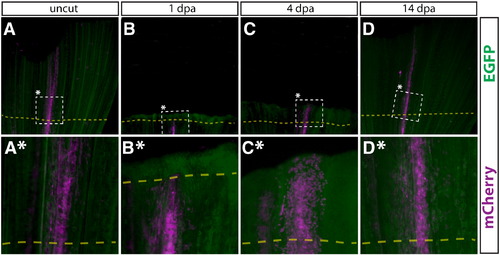
Intra-ray fibroblasts in regenerated fins are derived from pre-existing intra-ray fibroblasts. (A–D, A*–D*) Whole mount epifluorescent images of a Class 2 intra-ray fibroblast mosaic labeled caudal fin of the same Tg(dusp6:Cre-ERT2, EAB:EGFP-FlEx-mCherry) animal before amputation (A, A*), 1 dpa (B, B*), 4 dpa (C, C*), and 14 dpa (D, D*). The dashed box marks the zoomed region in the panel directly below. mCherry+ cells are shown in magenta. All other cells are EGFP+ (green). The amputation plane is shown with a dashed yellow line. |
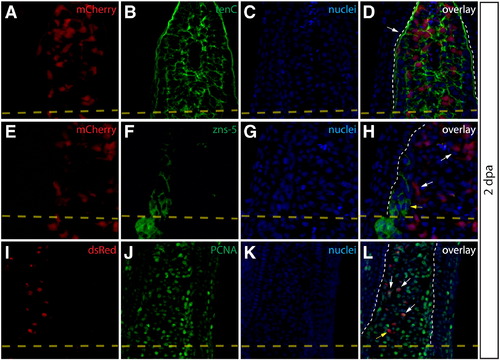
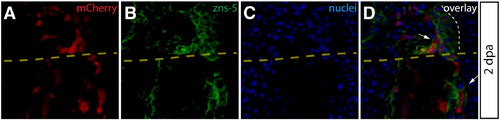
Intra-ray fibroblasts are a proliferating component of the blastema. (A–L) Longitudinal sections of Class 2 mosaic fins from Tg(dusp6:Cre-ERT2, EAB:EGFP-FlEx-mCherry) harvested 2 dpa and monitored for mCherry expression (A, E, I, red) and immunostained with indicated antibodies (B, F, J, green). Nuclei are stained with Hoechst (C, G, K, blue), and the three-color overlay is shown in each case (D, H, L). (A–D) Cells derived from intra-ray fibroblasts populate the blastema at 2 dpa. The section shows mCherry expression (A, red) and is immunostained with anti-tenascin C (tenC) antibodies (B, green). The white arrow indicates mCherry+ intra-ray fibroblasts and the white dashed line denotes the boundary between epidermis and blastema. (E–H) mCherry+ intra-ray fibroblasts do not express markers for osteoblasts in regenerating tissue. mCherry+ cells are shown in red and zns-5 antibodies detect osteoblasts (F, green). White arrows indicate mCherry+ cells in the blastema that do not co-localize with zns-5+ osteoblasts (yellow arrow). The white dashed line indicates the boundary between epidermis and blastema. (I–L) Intra-ray fibroblasts are a source of proliferating cells in the blastema. A 2 dpa section co-stained with anti-dsRed antibodies to detect mCherry+ cells (I, red) and anti-PCNA antibodies to detect proliferating cells (J, green). The white arrows indicate mCherry+/PCNA+ intra-ray fibroblasts in the blastema. The yellow arrow in panel (L) marks an mCherry+/PCNA intra-ray fibroblast. The border between epidermis and blastema is marked with a white dashed line. |

Newly regenerated bone is formed by pre-existing osteoblasts. (A–D, A*–D*) Whole mount images of a Tg(dusp6:Cre-ERT2, EAB:EGFP-FlEx-mCherry) Class 3 mosaic caudal fin containing mCherry labeled osteoblasts before amputation (A, A*), 1 dpa (B, B*), 4 dpa (C, C*), and 14 dpa (D, D*). The dashed box denotes the region magnified in the panel directly below. All cells are EGFP+ (green), except mCherry+ genetically recombined cells and their descendants (magenta). White arrows mark osteoblasts and yellow arrows denote cells co-labeled with mCherry+ osteoblasts. |
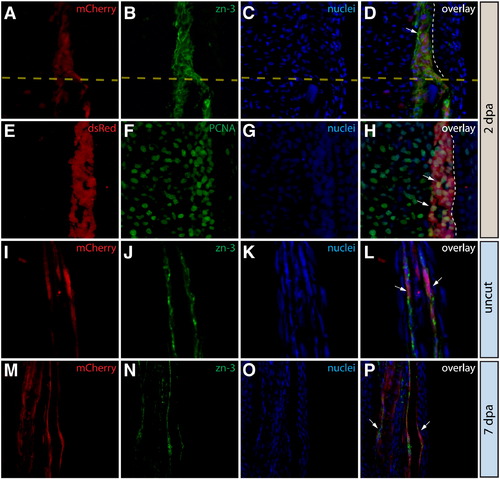
Osteoblasts in the caudal fin populate the blastema but remain fate restricted. (A–L) Longitudinal sections of the caudal fin of Tg(dusp6:Cre-ERT2, EAB:EGFP-FlEx-mCherry) Class 3 mosaic animals showing mCherry expression in osteoblasts (A, E, I, M, red) and stained with indicated antibodies (B, F, J, N, green) and with Hoechst to mark nuclei (C, G, K, O, blue). The three-color overlays are shown in (D, H, L, P). (A–D) Osteoblasts contribute to the blastema. A fin section observed for mCherry expression and immunostained with zn-3 antibodies to mark osteoblasts. White arrows indicate mCherry+ cells (red) in the blastema that co-localize with zn-3+ osteoblasts (green). The dashed yellow line marks the amputation site and the dashed white line indicates the epidermis–blastema boundary. (E–H) Osteoblast-derived blastema cells proliferate. A fin section from the same animal in (A–D) stained with anti-dsRed antibodies to detect mCherry expression (red) and with anti-PCNA antibodies (green) to mark proliferating cells. White arrows indicate mCherry+/PCNA+ intra-ray fibroblasts in the blastema. The border between epidermis and blastema is marked with a white dashed line. (I–P) Osteoblasts do not change fate during regeneration. Stained fin sections from the same Tg(dusp6:Cre-ERT2, EAB:EGFP-FlEx-mCherry) Class 3 mosaic animal prior to amputation (I–L) and 7 dpa (M–P). mCherry expression is red and anti-zn-3 antibody staining marks osteoblasts in green. The white arrows mark cells that are both mCherry and zn-3 positive. |
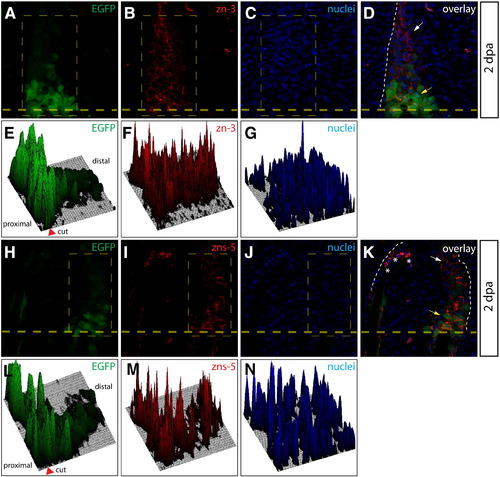
Osteoblasts dedifferentiate within the blastema. (A–D, H–K) Longitudinal sections from a Tg(sp7:EGFP) animal 2 dpa stained with zn-3 (A-D) or zns-5 antibodies (H–K). White arrows point to EGFP-/zn-3+ (or zns-5+) immature, dedifferentiated osteoblasts and yellow arrows point to EGFP+/zn-3+ (or zns-5+) mature, differentiated osteoblasts. EGFP signal is shown in green, zn-3+ (B, D), or zns-5+ (I, K) cells are red, and Hoechst-stained nuclei are blue. The border between epidermis and blastema is marked with a white dashed line. (E–G, L–M) Relative signal intensity levels for EGFP (E, L), zn-3 or zns-5 antibody staining (F, M), and Hoechst (G, N). Fluorescence intensity levels (z-axis) within the indicated rectangle (thin dashed yellow line) are plotted as a 3-dimensional surface using ImageJ software. The amputation site is marked with an arrowhead and the proximal and distal regions relative to the amputation site are indicated. The white dashed line indicates the border between epidermis and blastema. |
Antibody validation. (A–D) An anti-dsRed antibody detects mCherry expression in sectioned fins. A section from a Class 1 mosaic Tg(dusp6:Cre-ERT2, EAB:EGFP-FlExmCherry) fin immunostained with an anti-dsRed antibody (A, green) with mCherry expression shown in red (B). Nuclei are stained with Hoechst (C, blue) and the overlay is shown (D). All mCherry+ cells are positive for dsRed (white arrows). (E–L) The zns-5 and zn-3 antibodies stain osteoblasts. Sections of non-regenerating caudal fins from Tg(sp7:EGFP) fish showing EGFP expression (E, I green) and stained with zns-5 or zn-3 antibodies (F, J, red) and Hoechst (G, K, blue). The overlays (H, L) demonstrate co-localization of EGFP+ cells with zns-5+ or zn-3+ cells, respectively (cells marked with white arrows). |
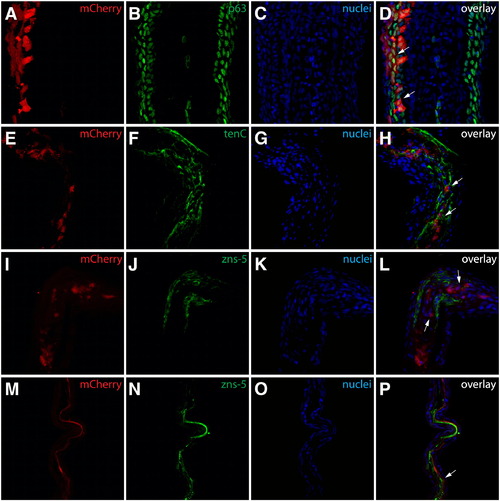
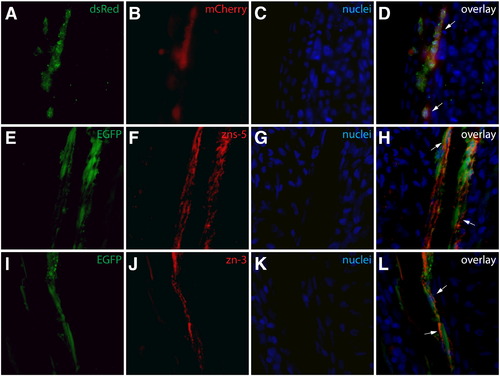
Identification of mosaic cell populations in the fins shown in Fig. 1. (A–D) Class 1 mosaics contain labeled epidermal cells. The fin shown in Figs. 1F and F* sectioned and stained with anti-p63 antibodies (B, green). mCherry+ (A, red) cells are found exclusively in epidermal layers and all are p63+ (white arrows). (E–L) Class 2 mosaics are composed of labeled intra-ray fibroblasts. The fin shown in Figs. 1G and G* sectioned and stained with antibodies recognizing tenascin C (F, green) or zns-5 (J, green). mCherry+ (red) cells are in a tenascin C rich extracellular matrix (white arrows in H) but do not express the osteoblast marker zns-5 (white arrows in L). (M–P) Class 3 mosaics comprise lepidotrichia-localized osteoblasts. The fin shown in Figs. 1H and H* sectioned and stained with zns-5 antibodies (N, green). mCherry+ (M, red) cells in lepidotrichia are also zns-5+ (white arrows). For all experiments, nuclei are stained with Hoechst (C, G, K, O, blue) and the three-color overlay is shown in the last column (D, H, L, P). |
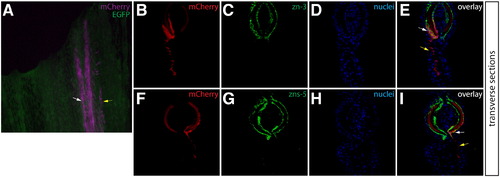
Osteoblasts and adjacent inter-ray cells are labeled in Class 3 mosaic fins. (A) Whole mount image of a Class 3 mosaic Tg(dusp6:Cre-ERT2, EAB:EGFP-FlEx-mCherry) fin demonstrating lepidotrichia-localized osteoblasts (white arrows) and adjacent non-osteoblast cells (yellow arrows). (B–I) Transverse sections from the same non-regenerating fin imaged for mCherry expression (B, F, red) and stained with either zn-3 or zns-5 antibodies (C, G, green) showing mCherry+/(zn-3 or zns-5)+ osteoblasts and inter-ray, non-osteoblast mCherry+/(zn-3 or zns-5) cells. Nuclei are stained with Hoechst (D, H, blue), and the overlays are shown (E, I). White arrows indicate mCherry+/(zn-3 or zns-5)+ osteoblasts and yellow arrows indicate mCherry single positive cells. |
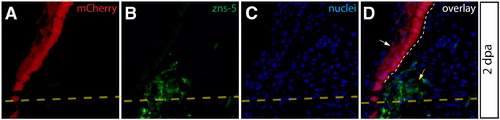
Epidermal cells do not give rise to zns-5 expressing blastema-populating osteoblasts. (A–D) High magnification visualization of mCherry+ epidermis from a 2 dpa Class 1 mosaic Tg(dusp6:Cre-ERT2, EAB:EGFP-FlEx-mCherry) fins imaged for mCherry expression (A, red) and stained with zns-5 antibodies (B, green). Nuclei are stained with Hoechst (blue). White arrows indicate mCherry+ epidermis that is negative for the osteoblast marker zns-5. Zns-5 positive osteoblasts are marked with a yellow arrow. The dashed yellow line indicates the site of amputation and a white dashed line indicates the border between epidermis and blastema. |
Putative macrophages in Class 4 mosaic fins are fate restricted during fin regeneration. (A–D, A*–D*) Whole mount epifluorescent images of a Class 4 mosaic caudal fin from a Tg(dusp6:Cre-ERT2, EAB:EGFP-FlEx-mCherry) animal containing mCherry+ putative macrophages before amputation (A, A*), 1 dpa (B, B*), 4 dpa (C, C*), and 14 dpa (D, D*). EGFP (green) and mCherry (magenta) signals are overlaid. The dashed box marked with an asterisk indicates the region shown at higher magnification in the panel directly below. The dashed line shows the approximate site of amputation. (A–D) and (A*–D*) are images acquired at 25 × and 120 × magnifications, respectively. |
Putative macrophages exhibit no net change in cell fate during regeneration. (A–H) Stained fin sections from the same Tg(dusp6:Cre-ERT2, EAB:EGFP-FlEx-mCherry) Class 4 mosaic animal prior to amputation (A–D) and 7 dpa (E–H). mCherry expression is red (A, E) and p63 antibody staining marks epidermal cells in green (B, F). Nuclei are stained with Hoechst (C, G, blue) and the overlays are shown in (D, H). White arrows mark cells within the epidermis that are mCherry+ and p63–. |
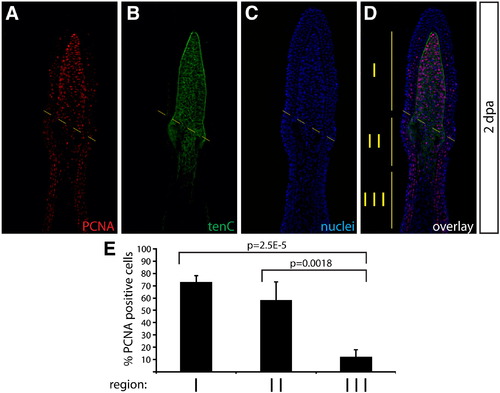
Cell proliferation is increased in tenascin C matrix localized blastema cells. (A–D) A representative image of a caudal fin harvested 2 dpa stained with anti-PCNA (A, red) and anti-tenascin C antibodies (B, green). Hoechst staining marks nuclei (C, blue). The amputation site is shown with a dashed light yellow line. The vertical solid yellow lines in the overlay (D) distinguish three regions in the regenerating fin marked by being distal (region I) or proximal (regions II and III) to the amputation site and by the presence of a tenascin C+ extracellular matrix (regions I and II). (E) A bar graph showing the mean percent of PCNA+ proliferating cells in each denoted region of the regenerating fin. Error bars represent the standard deviation between four animals. P values are calculated using a Student′s t-test. |
mCherry+ osteoblast-derived blastema cells adjacent to the amputation site do not downregulate zns-5 antigen expression. (A–D) A longitudinal fin section from a Class 3 mosaic Tg(dusp6:Cre-ERT2, EAB:EGFP-FlEx-mCherry) animal 2 dpa containing mCherry+ osteoblasts (A, red) and stained with zns-5 antibodies (B, green). Hoechst staining marks nuclei (C, blue). White arrows indicate mCherry+/zns-5+ cells and the border between epidermis and blastema is denoted with a white dashed line. The yellow dashed line shows the approximate site of amputation. |
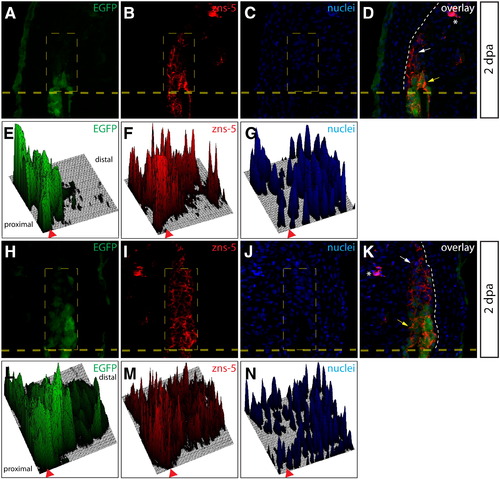
Osteoblasts dedifferentiate as they enter the blastema. (A–D, H–K) Sections from two Tg(sp7:EGFP) animals 2 dpa imaged for EGFP expression (A, H, green) and stained with zns-5 antibodies (B, I, red). Nuclei are stained with Hoechst (C, J, blue) and the overlay is shown (D, K). A heavy dashed yellow line indicates the amputation plane and a white dashed line marks the epidermis–blastema boundary. White arrows point to zns-5+/EGFP immature, dedifferentiated osteoblasts and the yellow arrows indicate zns-5+/EGFP+ mature, differentiated osteoblasts. Asterisks mark background-staining red blood cells. (E–G, L–N) Fluorescent signal intensities for EGFP (E, L), zns-5 staining (F, M) and Hoechst (G, N) within the indicated rectangle (thin, dashed yellow line in A–C and H–J) are plotted as 3-dimensional surfaces using ImageJ software. The amputation site is marked with an arrowhead and proximal and distal regions relative to the amputation site are indicated. |
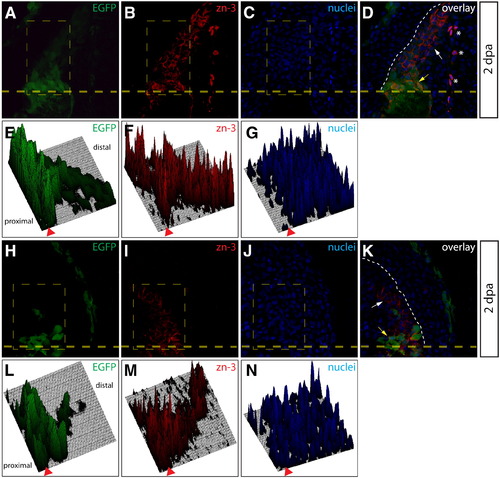
Additional evidence for dedifferentiation of osteoblast-derived cells populating the blastema. (A–D, H–K) Sections from two Tg(sp7:EGFP) animals 2 dpa imaged for EGFP expression (A, H, green) and stained with zn-3 antibodies (B, I, red). Nuclei are stained with Hoechst (C, J, blue) and the overlay is shown (D, K). A heavy dashed yellow line indicates the amputation plane and a white dashed line marks the epidermis–blastema boundary. White arrows point to mCherry+/zn-3 immature, dedifferentiated osteoblasts and the yellow arrows indicate mCherry+/zn-3+ mature, differentiated osteoblasts. Asterisks mark background-staining red blood cells. (E–G, L–N) Fluorescent signal intensities for EGFP (E, L), zn-3 staining (F, M) and Hoechst (G, N) within the indicated rectangle (thin, dashed yellow line in A–C and H–J) are plotted as 3-dimensional surfaces using ImageJ software. The amputation site is marked with an arrowhead and proximal and distal regions relative to the amputation site are indicated. |
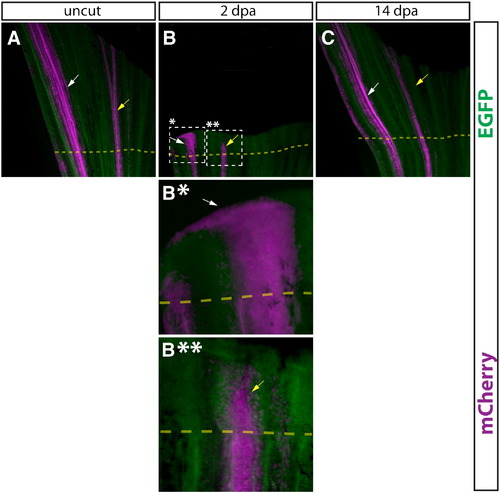
Comparison of epidermal cells and intra-ray fibroblasts during regeneration. (A–D, A*–D*) Whole mount epifluorescent images of a caudal fin from a Tg(dusp6:Cre-ERT2, EAB:EGFP-FlEx-mCherry) animal containing both Class 1 epidermis and Class 2 intra-ray fibroblast mosaics before amputation (A), 2 dpa (B, B*, B**), and 14 dpa (C). Both EGFP (green) and mCherry (magenta) are shown in all panels. The dashed box marked with single asterisk outlines a region of labeled epidermis shown at higher magnification in (B*) and the dashed box marked with double asterisk indicates a region of labeled intra-ray fibroblasts shown at higher magnification (B**). The dashed yellow line shows the approximate amputation site. White arrows point at mCherry+ epidermal cells and yellow arrows indicate mCherry-labeled fibroblasts or fibroblast-derived cells. |
Reprinted from Developmental Biology, 365(2), Stewart, S., and Stankunas, K., Limited dedifferentiation provides replacement tissue during zebrafish fin regeneration, 339-349, Copyright (2012) with permission from Elsevier. Full text @ Dev. Biol.