
- Title
-
2-O-sulfotransferase regulates Wnt signaling, cell adhesion and cell cycle during zebrafish epiboly
- Authors
- Cadwalader, E.L., Condic, M.L., and Yost, H.J.
- Source
- Full text @ Development
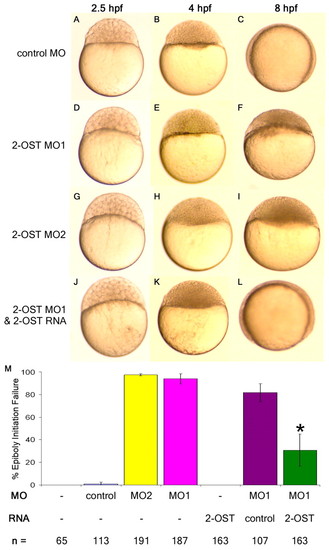
2-OST is necessary for epiboly in early zebrafish development. (A-L) Embryos (1- to 2-cell stage) were injected with 3 ng control MO (A-C), 3 ng of 2-OST MO1 (D-F), 3 ng of 2-OST MO2 (G-I), or mixture of 3 ng 2-OST MO1 and 0.2 ng 2-OST RNA (J-L), then incubated in embryo water at 28°C. They were examined at 2.5 hpf (A,D,G,J), 4 hpf (B,E,H,K) and 8 hpf (C,F,I,L). (M) Quantitative comparison of injections and rescue scored based on failure to initiate epiboly. The co-injection of 2-OST MO+2-OST RNA rescued the percentage of embryos that fail to initiate epiboly in the 2-OST MO alone or the 2-OST MO+control RNA by >50%. *P<0.05. Error bars represent s.d. PHENOTYPE:
|
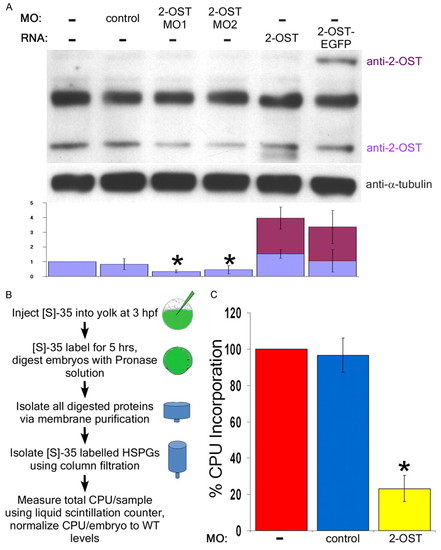
2-OST morphants display reduced levels of 2-OST protein and reduced levels of 35S incorporation. (A) By western blot, levels of 2-OST protein were shown to be statistically significantly reduced by roughly half using both 2-OST MO1 and MO2 compared with WT and control embryos at 4 hpf. The antibody was validated using 2-OST RNA, with degradation product or altered post-translational modifications beneath the band, and 2-OST-EGFP RNA (two embryos/lane/sample, n=4 experiments). Quantification of protein levels was normalized to uninjected levels of 2-OST relative to the total levels of α-tubulin per sample. (B) WT, control MO and 2-OST MO embryos were injected with 1 nl 10 mCi 35S, grown for five hours, and collected at 8 hpf (n=3, 90 embryos group/n). Protein purification was performed to isolate radiolabeled GAG chains and cpu per embryo was calculated based on liquid scintillation counting results. (C) Ratio of 35S incorporation per embryo was normalized to WT. The 2-OST morphants exhibit a nearly 80% decreased rate of incorporation of 35S compared with WT and control morphants. *P<0.05. Error bars represent s.d. EXPRESSION / LABELING:
|
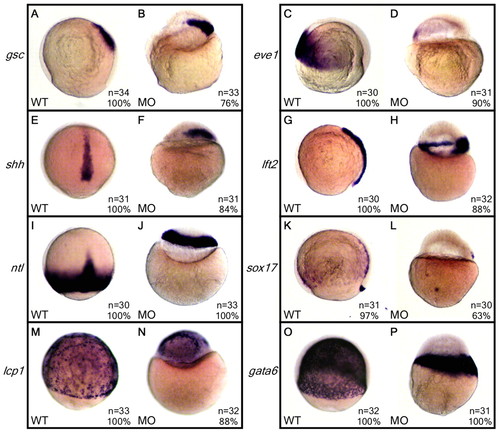
Molecular marker expression in WT and 2-OST morphant embryos. (A-P) Wild-type embryos were injected with 3 ng of either control MO or 2-OST MO, fixed at 8 hpf, and processed for whole-mount in situ hybridization. Expression patterns of mesoderm markers (A-F), mesendoderm markers (G-J), a DFC and endoderm marker (K,L), an ectoderm marker (M,N) and a YSN marker (O,P) were analyzed. The presence and organization of these markers in both the WT and morphant embryos suggest that 2-OST morphants were establishing the primary germ layers and axes. Furthermore, the presence of sox17 and shh, which are expressed later in development, indicate that the 2-OST morphants were not severely delayed in development. |
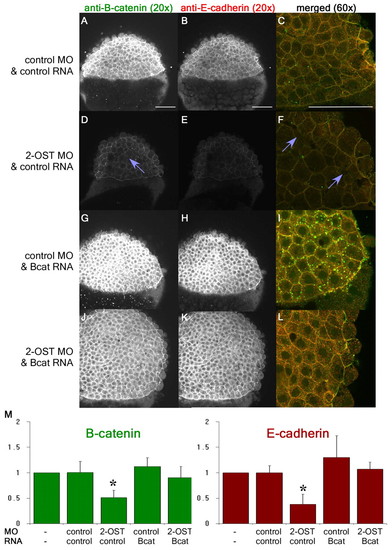
β-Catenin accumulation is dependent on 2-OST. (A,D,G,J) Single planes of z-stack at 4 hpf of β-catenin for control MO+control RNA- (A), 2-OST MO+control RNA- (D), control MO+stabilized β-catenin RNA-(G), and 2-OST MO+stabilized β-catenin RNA (J)-injected embryos. (B,E,H,K) Single planes of z-stack of E-cadherin control MO+ control RNA- (B), 2-OST MO+control RNA- (E), control MO +stabilized β-catenin RNA- (H), and 2-OST MO+stabilized β-catenin RNA (K)-injected embryos. (C,F,I,L) Merged images of β-catenin and E-cadherin for control MO+control RNA (C), 2-OST MO+control RNA- (F), control MO+stabilized β-catenin RNA- (I), and 2-OST MO +stabilized β-catenin RNA (L)-injected embryos (n=21 for each group). The purple arrows indicate regions in which adhesion is completely lost between deep cells based on dark spaces and altered cellular morphology. Scale bars: 100 μm. (M) Western blot results, comparing band densitometry at 4 hpf. β-catenin (green) levels per sample were normalized to α-tubulin levels per sample, and then WT, control MO and control RNA, 2-OST MO and control RNA, control MO and stabilized β-catenin RNA, and 2-OST MO and stabilized β-catenin RNA were each normalized to WT, using WT as a value of 1. The same was done for the E-cadherin (red) (two embryos/lane/sample, n=5 experiments). *P<0.05 for levels of protein statistically significantly different for the 2-OST MO and control RNA compared with all the other samples on the chart. Error bars represent s.d. PHENOTYPE:
|
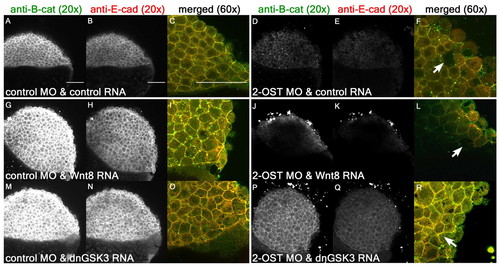
2-OST modulates Wnt signaling upstream of Gsk3 and downstream of Wnt8. (A,D,G,J,M,P) Single planes of z-stack at 4 hpf of β-catenin for control MO+control RNA- (A), 2-OST MO+control RNA- (D), control MO+Wnt8 RNA- (G), 2-OST MO+Wnt8 RNA- (J), control MO+dnGSK3 RNA- (M) and 2-OST MO+dnGSK3 RNA (P)-injected embryos. (B,E,H,K,N,Q) Cross-sections of E-cadherin for control MO+control RNA- (B), 2-OST MO+control RNA- (E), control MO+Wnt8 RNA- (H), 2-OST MO+Wnt8 RNA- (K), control MO+dnGSK3 RNA- (N) and 2-OST MO+dnGSK3 RNA (Q)-injected embryos. (C,F,I,L,O,R) Merged and magnified cross-sections of β-catenin and E-cadherin for control MO and control RNA- (C), 2-OST MO+control RNA- (F), control MO+Wnt8 RNA- (I), 2-OST MO+Wnt8 RNA- (L), control MO+dnGSK3 RNA- (O) and 2-OST MO+dnGSK3 RNA (R)-injected embryos. Arrows indicate regions in which adhesion is completely lost between deep cells based on dark spaces and altered cellular morphology. Scale bars: 100 μm. |
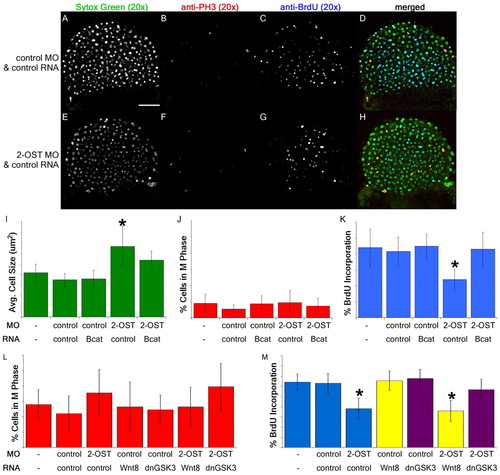
2-OST contributes to regulation of cell proliferation via β-catenin. (A,E) Single planes of z-stack of Sytox Green nuclear stain for control MO+control RNA- (A) and 2-OST MO+control RNA (E)-injected embryos. (B,F) Anti-phospho-histone H3 immunostaining of control MO+control RNA- (B) and 2-OST MO+control RNA (F)-injected embryos. (C,G) Anti-BrdU immunostaining of control MO+control RNA- (C) and 2-OST MO+control RNA (G)-injected embryos. (D,H) Merged images of Sytox Green, anti-phospho-histone-H3 and anti-BrdU staining of control MO+control RNA- (D) and 2-OST MO+control RNA (H)- injected embryos. Scale bar: 100 μm. (I) Comparison of average cell area. The cell area for 2-OST MO+control RNA-injected samples was statistically significantly different from all the other samples cell areas. (J) Comparison of percentage of cells in M phase. (K) Comparison of rate of cell proliferation. The rate of proliferation for 2-OST MO+control RNA-injected embryos was statistically significantly different from all the other samples rates of proliferation and was nearly half the rate of the controls. n=15 per group. (L) Comparison of percentage of cells in M phase. (M) Comparison of rate of proliferation. The rate of proliferation for the 2-OST MO+control RNA- and 2-OST MO+Wnt8 RNA-injected embryos was nearly half the rate of the controls (n=15 for each group). All these experiments were conducted at 4 hpf. *P<0.05. Error bars represent s.d. PHENOTYPE:
|
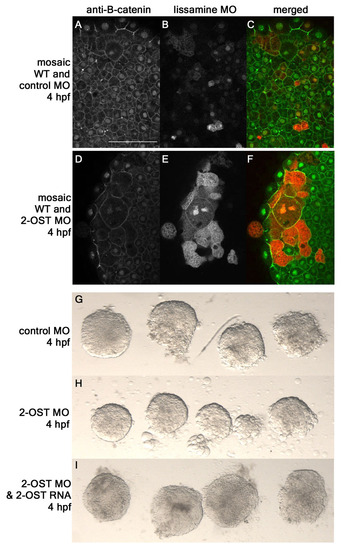
Adhesion defects in 2-OST MO are cell autonomous. (A-F) Single planes of z-stack at 4 hpf of mosaic embryos formed from injecting either control MO+lissamine-conjugated MO (B,C) or 2-OST MO+lissamine-conjugated MO (E,F) into a single cell at the 32-cell stage. Anti-β-catenin for control MO mosaic (A) or 2-OST MO (D). (G-I) Animal caps removed and immediately imaged from control MO (G), 2-OST MO (H), or 2-OST MO+2-OST RNA (I) embryos to examine adhesion defects. Minimal cells were observed around control MO and rescue-injected animal caps, but many cells were observed around 2-OST MO, indicating decreased adhesion. PHENOTYPE:
|
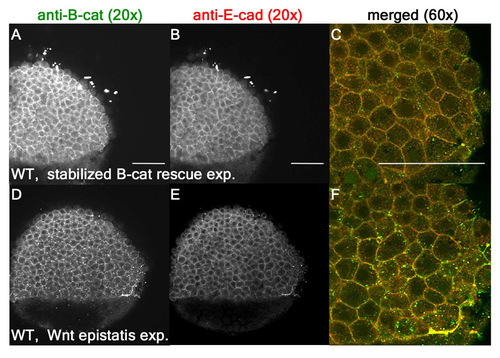
WT and control morphants exhibit comparable levels of β-catenin and E-cadherin. (A-F) WT levels are comparable to control MO embryos for β-catenin (A,C,D,F) and E-cadherin (B,C,E,F) in stabilized β-catenin rescue experiments as well as Wnt epistasis experiments. |

Unillustrated author statements PHENOTYPE:
|