
|
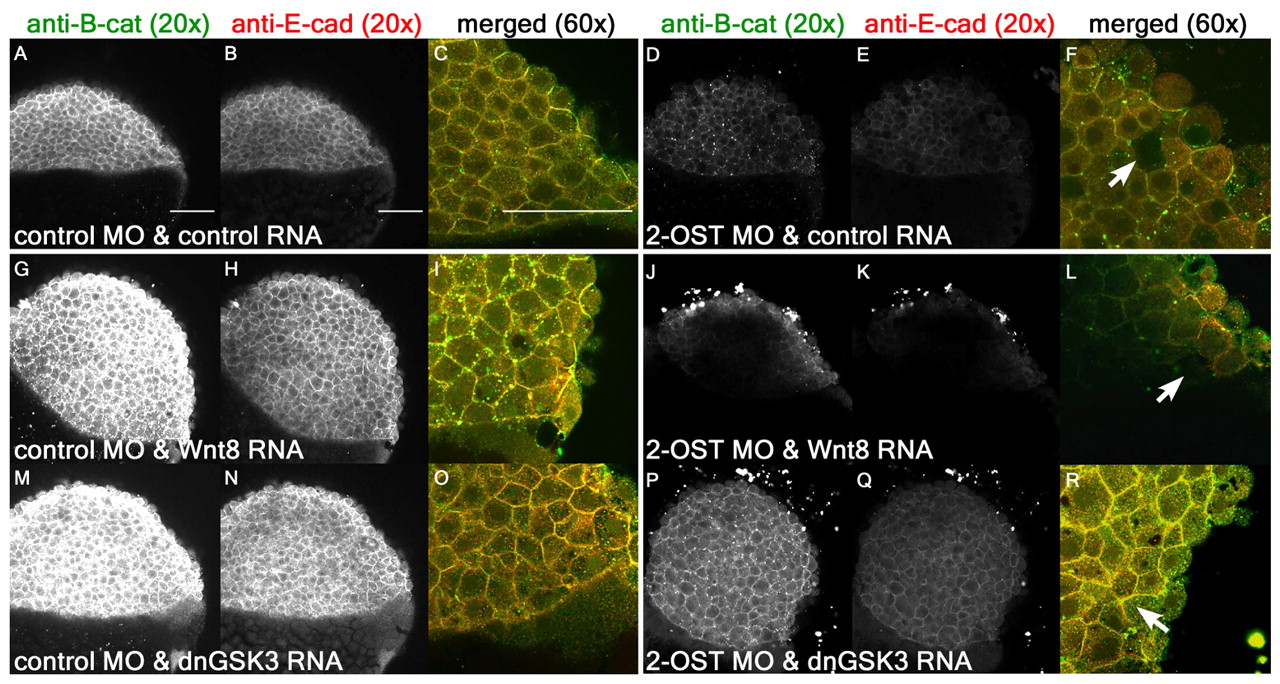
Fig. 6
2-OST modulates Wnt signaling upstream of Gsk3 and downstream of Wnt8. (A,D,G,J,M,P) Single planes of z-stack at 4 hpf of β-catenin for control MO+control RNA- (A), 2-OST MO+control RNA- (D), control MO+Wnt8 RNA- (G), 2-OST MO+Wnt8 RNA- (J), control MO+dnGSK3 RNA- (M) and 2-OST MO+dnGSK3 RNA (P)-injected embryos. (B,E,H,K,N,Q) Cross-sections of E-cadherin for control MO+control RNA- (B), 2-OST MO+control RNA- (E), control MO+Wnt8 RNA- (H), 2-OST MO+Wnt8 RNA- (K), control MO+dnGSK3 RNA- (N) and 2-OST MO+dnGSK3 RNA (Q)-injected embryos. (C,F,I,L,O,R) Merged and magnified cross-sections of β-catenin and E-cadherin for control MO and control RNA- (C), 2-OST MO+control RNA- (F), control MO+Wnt8 RNA- (I), 2-OST MO+Wnt8 RNA- (L), control MO+dnGSK3 RNA- (O) and 2-OST MO+dnGSK3 RNA (R)-injected embryos. Arrows indicate regions in which adhesion is completely lost between deep cells based on dark spaces and altered cellular morphology. Scale bars: 100 μm.