
|
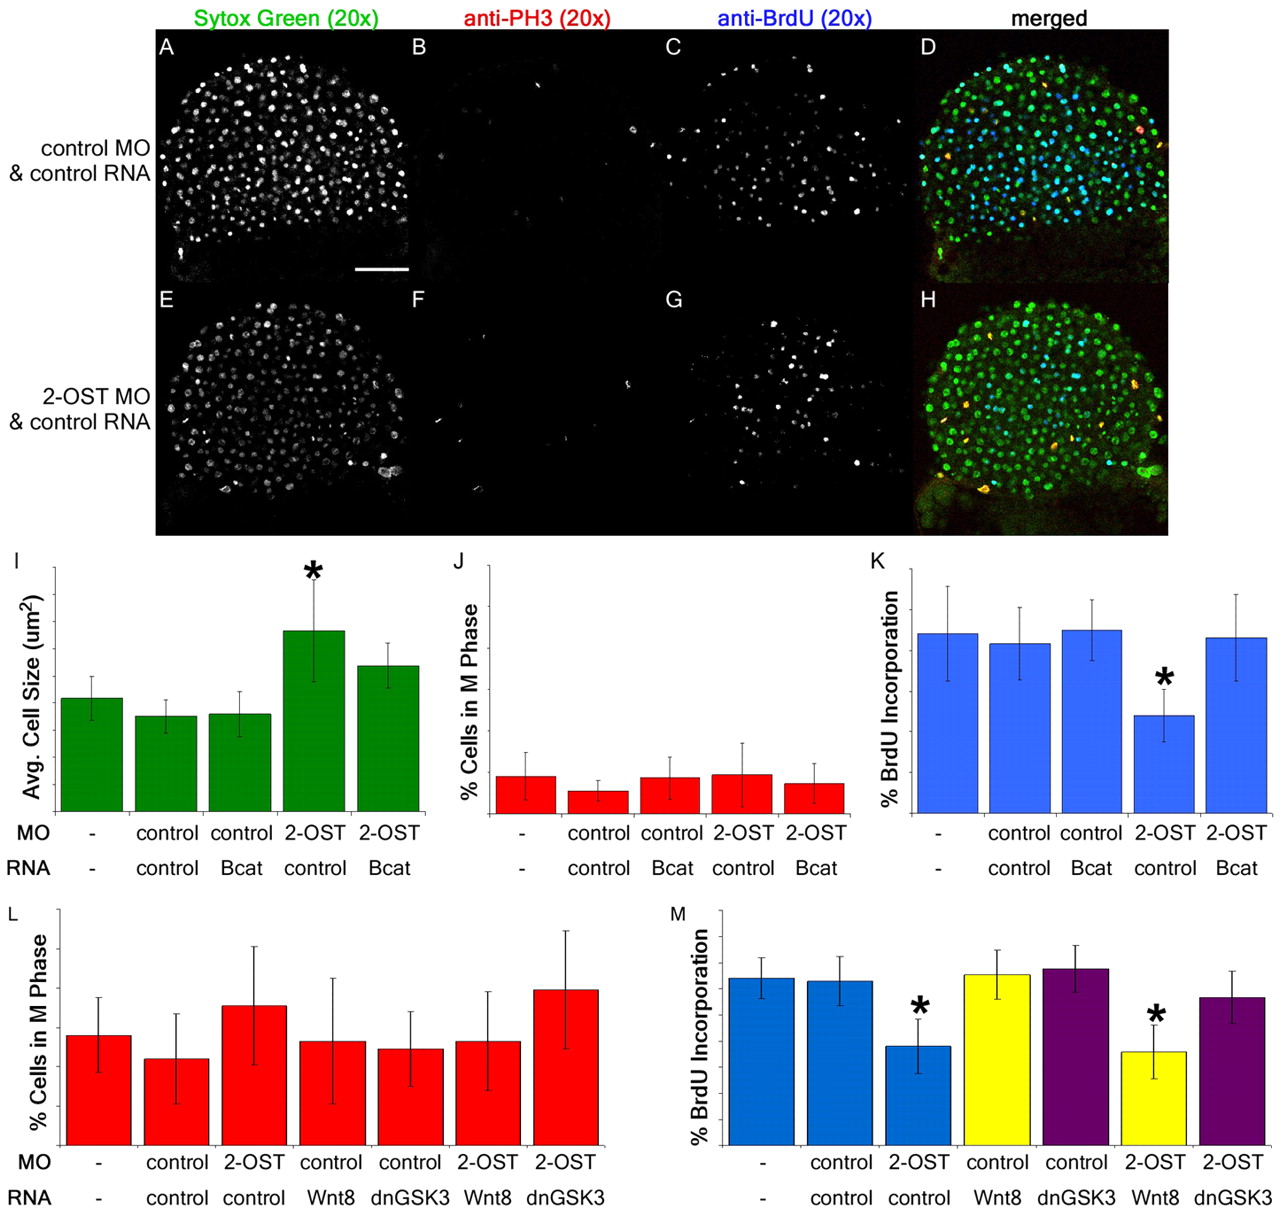
Fig. 7
2-OST contributes to regulation of cell proliferation via β-catenin. (A,E) Single planes of z-stack of Sytox Green nuclear stain for control MO+control RNA- (A) and 2-OST MO+control RNA (E)-injected embryos. (B,F) Anti-phospho-histone H3 immunostaining of control MO+control RNA- (B) and 2-OST MO+control RNA (F)-injected embryos. (C,G) Anti-BrdU immunostaining of control MO+control RNA- (C) and 2-OST MO+control RNA (G)-injected embryos. (D,H) Merged images of Sytox Green, anti-phospho-histone-H3 and anti-BrdU staining of control MO+control RNA- (D) and 2-OST MO+control RNA (H)- injected embryos. Scale bar: 100 μm. (I) Comparison of average cell area. The cell area for 2-OST MO+control RNA-injected samples was statistically significantly different from all the other samples cell areas. (J) Comparison of percentage of cells in M phase. (K) Comparison of rate of cell proliferation. The rate of proliferation for 2-OST MO+control RNA-injected embryos was statistically significantly different from all the other samples rates of proliferation and was nearly half the rate of the controls. n=15 per group. (L) Comparison of percentage of cells in M phase. (M) Comparison of rate of proliferation. The rate of proliferation for the 2-OST MO+control RNA- and 2-OST MO+Wnt8 RNA-injected embryos was nearly half the rate of the controls (n=15 for each group). All these experiments were conducted at 4 hpf. *P<0.05. Error bars represent s.d.