
- Title
-
Analysis of Pax7 expressing myogenic cells in zebrafish muscle development, injury, and models of disease
- Authors
- Seger, C., Hargrave, M., Wang, X., Chai, R.J., Elworthy, S., and Ingham, P.W.
- Source
- Full text @ Dev. Dyn.
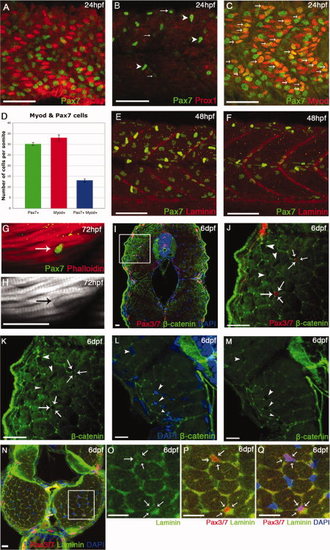
Ontogeny of Pax7+ve cells in the myotome. A–C,F–J: Lateral flatmounts of embryos stained with α-Pax7 monoclonal antibody (mAb): anterior is to the left and dorsal up. A: Around 30 weakly labeled rounded Pax7+ve cells nestle between slow muscle nuclei (labeled by Prox1 - red) in the lateral myotome of each somite at 24 hours post fertilization (hpf). B: At the same stage, weak Pax7 immunoreactivity is detected in round cell nuclei located more superficially (arrows) and at much higher levels in the xanthophores, bean-shaped cells that are elongated along the dorsoventral axis (arrowheads). C,D: At 24 hpf, approximately a third of Pax7+ve cells are differentiating as they co-express Myod (arrows). Numbers based on analysis of three somites in four to seven animals, error bars show standard error. Counts include only weakly stained rounded Pax7+ve cells and exclude intensely stained elongated Pax7+ve xanthophores. E,F: At 48 hpf, the xanthophores remain strongly labeled; weaker Pax7+ve cells (green) are dispersed throughout the somite but several have aligned along the vertical and horizontal myosepta, labeled with anti-Laminin (red). G,H: From 3 days postfertilization (dpf), some Pax7+ve cells associate closely with myofibers stained with Phalloidin (actin, red). I–M: Pax3/7 cells are surrounded by β-catenin staining in cryostat cross-sections at 6 dpf (arrows), while other myonuclei are not fully surrounded (arrowheads). J,K are magnifications of the boxed area in I. N–Q: Cross-section of muscle fibers labeled with αPax3/7 (red) and Laminin (green) show that Pax3/7+ve cells are surrounded by laminin staining (arrows) at 6 dpf. Scale bar = 50 μm in A–C,E,F, 25 μm in I–Q. |
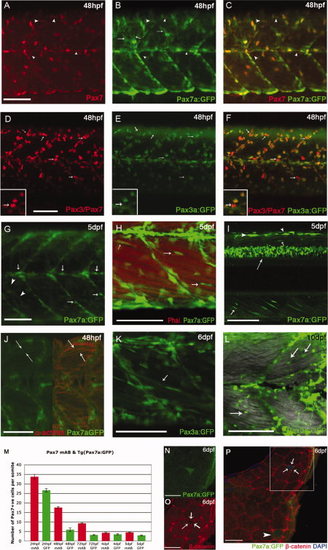
Expression of TgBAC(pax7a:GFP)i131 and TgBAC(pax3a:GFP)i150 recapitulates the patterns of the endogenous genes in the myotome. A–C: At 24 hours post fertilization (hpf), Pax7 protein (A) and TgBAC(pax7a:GFP)i131 expression (B) mostly coincide (C), arrowheads highlight cells detected with α-Pax7, but barely GFP+ve. Green fluorescent protein (GFP) expression is also detected in processes extending from the xanthophores (B, arrows). D–F: At 48 hpf, labeling with α-DP312 (Pax3/Pax7) (D) and GFP expression driven by TgBAC(pax3a:GFP)i150 (E) show significant overlap (F); some nuclei labeled strongly by DP312 show little or no GFP expression, consistent with some cells expressing only Pax7 (arrows, inserts). G–I: Increasingly medial planes through 5 days postfertilization (dpf) TgBAC(pax7a:GFP)i131 larvae: at a superficial level, expression is observed in xanthophores (arrowheads) and along the horizontal and vertical myosepta (arrows, G). H: More medially, Pax7a cells align closely to myofibers, stained with Phalloidin (actin, red; arrows). I: Intense GFP expression in dorsal spinal cord (long arrow), dorsal neural crest cells (arrowheads), and alongside myofibers (small arrows). J: Individual fibers (α-actinin, red) are labeled in 48 hpf TgBAC(pax7a:GFP)i150 reflecting perdurance of the GFP protein. K,L: TgBAC(pax3a:GFP)i150 at 6 dpf: expression persists in fibers (K) and remains in rounded cells alongside the fibers at 10 dpf (L). M: Quantification of Pax7+ve nuclei at 24 hpf to 5 dpf detected in fixed specimens with αPax7 mAb and in vivo pax7a:GFP+ve cells. Counts include only weakly stained or weakly expressing Pax7+ve cells per somite and exclude intensely stained elongated Pax7+ve xanthophores. N–P: Cross-sections of Tg(Pax7a:GFP)i131 show a Pax7a:GFP+ve cell fully surrounded by β-catenin (arrows) and persistence of GFP in an individual fiber (arrowhead) at 6 dpf. N,O are magnifications of the boxed area in P. Scale bars = 50 μm in A–L, 25 μm in N–P. |
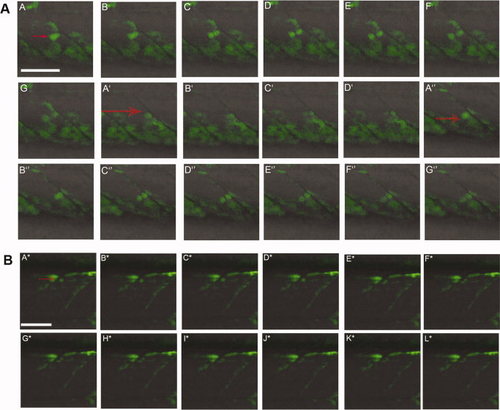
Following Pax7a+ve cell division in live embryos. A: Sequences of images of a 34 hours post fertilization (hpf). TgBAC(pax7a:GFP)i131 embryo captured every 90 sec. Individual GFP+ve cells (red arrows) can be seen dividing in each somite. A–G, A2–D2, A3–G3: Three different cell divisions are shown. In each case, one of the two daughter cells moves into the myotome while the other remains close to the vertical myoseptum. B: Series of images of a TgBAC(pax7a:GFP)i131 embryo at 58 hpf showing a GFP+ve cell (red arrow) dividing in the dorsal somite (A*–L*). The more ventral daughter cell appears to elongate to form a myofiber. The individual images were taken approximately 160 sec apart. Scale bar = 50 μm. |
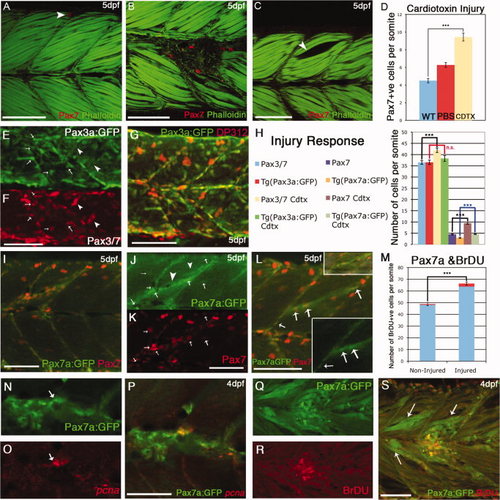
Behavior of Pax7+ve cells in response to cardiotoxin-induced injury. A: By 5 days postfertilization (dpf), Pax7+ve cells are relatively scarce in individual somites of uninjured larvae: in this image a single labeled cell (red: αPax7) is located at the dorsal extreme (arrow). B: Cardiotoxin injected larvae at 5 days postfertilization (dpf): several Pax7+ve cells accumulate at the site of injury. C: Control injection with phosphate buffered saline (PBS) creates a gap in the myotome (arrow) but no accumulation of Pax7+ve cells. D: numbers of Pax7+ve cells accumulated at the site of injury within 24–48 hr of injection into the somite with 0.3mg/ml Cardiotoxin (yellow bar) compared with noninjured (blue bar); injection with PBS alone resulted in fewer Pax7+ve cells present (red bar). Numbers based on analysis of three somites in four to seven animals, error bars show standard error. Asterisks: P < 0.001. Counts include only weakly stained Pax7+ve cells and exclude intensely stained elongated Pax7+ve xanthophores. E–G: Five dpf injured TgBAC(pax3a:GFP)i150 stained with DP312 (Pax3/Pax7), which labels both GFP+ve cells (arrows) and bright xanthophores (arrowheads). H: Numbers of Pax3+ve and Pax7+ve cells compared with their respective transgenic lines in noninjured and injured backgrounds. The numbers of Pax7+ve cells counted in fixed specimens was significantly higher in injured vs. noninjured somites in TgBAC(pax7a:GFP)i131 embryos and Pax7mAb stained embryos, while no significant increase was observed following injury of TgBAC(pax3a:GFP)i150 embryos compared with noninjured TgBAC(pax3a:GFP)i150 embryos. Numbers based on analysis of three somites in four to seven animals, error bars show standard error. Asterisks: P < 0.005. I–K: 5 dpf injured TgBAC(pax7a:GFP)i131 stained with αPax7 mAb (K, red). Individual Pax7+ve cells are positive both for Pax7and pax7a:GFP (arrows, J,K), but up-regulation of GFP is also seen in the injured fibers (arrowheads, J). L: Another example of an injured 5 dpf TgBAC(pax7a:GFP)i131 with small inserts showing the injury site and the GFP channel with individual cells alongside the injured fibers (arrows). M: Number of bromodeoxyuridine-positive (BrDU+ve) nuclei in injured vs. noninjured TgBAC(pax7a:GFP)i131 embryos at 4 dpf. While there is a significant increase of labeled BrDU+ve cells overall, the proportion of BrDU+ve GFP+ve labeled cells is significantly increased in injured vs. noninjured fish (marked in red shading in the graph). Numbers based on analysis of three somites in 4–7 animals, error bars show standard error. Asterisks: P < 0.005. Counts include only weakly expressing GFP+ve cells and exclude intensely expressing elongated Pax7a:GFP xanthophores. N–P: A GFP+ve cell (arrow) in an injured 4 dpf TgBAC(pax7a:GFP)i131(N) expresses pcna mRNA (O, red). Q–S: BrdU labeling (R, red) of GFP+ve cells in TgBAC(pax7a:GFP)i131 (Q) embryos injured at 4 dpf. Note also up-regulation of GFP expression in fibers around the injury site (S, arrows). Scale bar = 50 μm. |
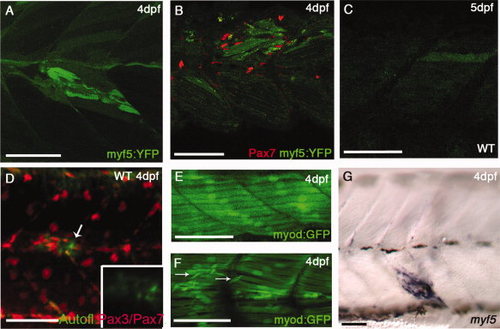
myf5:YFP (YFP, yellow fluorescent protein) and myod:GFP (GFP, green fluorescent protein) in cardiotoxin-induced injury. A,B: Injured Tg(myf5:YFP)CLGY237 larva at 4 days postfertilization (dpf): note up-regulation of YFP expression in fibers around the injury site (A) and accumulation of Pax7+ve cells around the YFP+ve fibers (B). C,D: Injured wild-type larva at 5 dpf (C) and at 4 dpf (D) showing slight auto-fluorescence in the injured fiber: this is much weaker and more diffuse than the signal seen in the Tg(myf5:YFP)CLGY237 injured larvae. E,F: Control (E) and injured TgBAC(myod:GFP)i124 (F) larva at 4 dpf: note new small myod-expressing fibers that have formed in response to injury (arrows in E). G: Expression of myf5 (assayed by in situ hybridization) in fibers localized at the site of injury in a 4 dpf larva. |

Behavior of Pax7+ve cells in dystrophic muscle. A,B: Birefringence of muscle fibers in polarized light reveals large gaps in sapjeta222a mutant larvae compared with wild-type at 5 days postfertilization (dpf). C: Pax7+ve cells can be seen within the gaps of degrading myofibers in sapjeta222a mutants at 2 dpf (arrows show a subset of Pax7+ve cells localized within the lesion sites). D,E: Pax7+ve cells continue to accumulate at 3 dpf and 4 dpf in sapjeta222a mutants as fewer fully intact fibers remain (arrows show Pax7+ve cells nestled in between detached myofibers, arrowheads xanthophores). F: Increase in numbers of Pax7+ve nuclei at 3 dpf in damaged somites (yellow bar) of sapjeta222a mutants compared with wild-type (blue bar). Counts in less severely damaged somites are slightly reduced (red bar). The Y-axis shows the number Pax7+ve cells per somite. Numbers based on analysis of three somites in four to seven animals, error bars show standard error. Asterisks: P < 0.001. Counts include only weakly stained rounded Pax7+ve cells and exclude intensely stained elongated Pax7+ve xanthophores. G,H: Accumulation of Pax7+ve cells in the myotome of 3 dpf larvae following morpholino mediated knock down of Integrin α7 expression. Scale bar = 50 μm. |
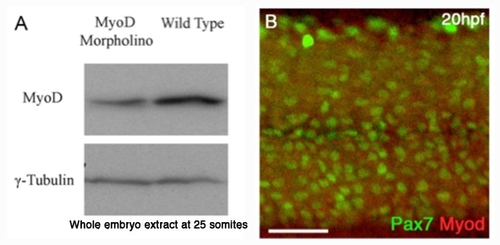
αMyod antibody A: Affinity purified αMyod antibody recognises the zebrafish Myod protein in extracts of 25 somite stage (~19-20hpf) embryos and is reduced in extracts of Myod-MO injected fish at this stage. B: Myod-Morpholino (MO) injected fish display reduced levels of αMyod reactivity at 20hpf relative to γ-tubulin control. |
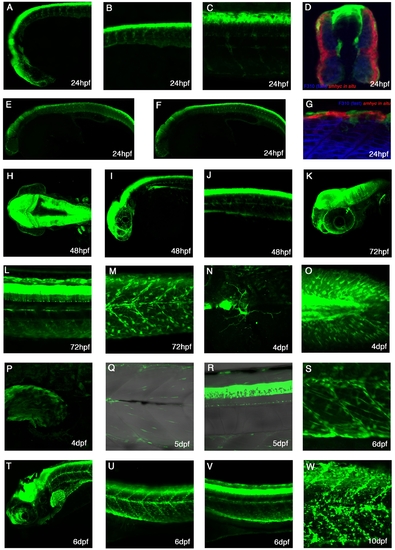
Expression patterns of TgBAC(pax3a:GFP)i150 A-C: Lateral view of a 24hpf live embryo showing strong expression in the diencephalon, mid-hindbrain, dorsal spinal cord, cranial neural crest cells and trunk neural crest.D:Cross-section of a 24hpf embryo stained with F310 to mark the fast muscle and smhc in situ probe to mark the slow muscle. Expression can be seen in the dorsal spinal cord, trunk neural crest and dermomyotome. E,F: Lateral views of 24hpf embryos, whereby E is more superficial than F. G: Lateral view of a 24hpf embryo stained with F310 to mark the fast muscle and smhc in situ probe to stain the slow muscle. Trunk neural crest cells can be seen. H: Dorsal view of 48hpf embryo with strong expression in the mid-hindbrain and in the pectoral fins. I: Lateral view of a 48hpf embryo shows next to strong brain expression many neural crests on the eye. J: At 48hpf, the expression is seen in the trunk neural crest cells and dorsal spinal cord. K: A lateral image stack at 72hpf reveals expression in cranial ganglia, which lies medial to the eye. L: At 72hpf, processes of spinal cord neurons can be seen. M: At 72hpf, expression is seen in multiple trunk crest cells and myotomal cells. N: At 4dpf a cell with processes is seen on the yolk ball. O: At 4dpf, mutltiple Pax3a:GFP cells are in the caudal fin. P: Pax3a:GFP expression can also be found in the pectoral fin at 4dpf. Q: Pax3a:GFP continues to be expressed within the myotome. R: At 5dpf, Pax3a:GFP expression is in the dorsal spinal cord. S: At 6dpf, numerous Pax3a:GFP cells can be found elongated alongside myofibres as well as rounded up and some along the myosepta. T-V: Lateral view of a 6dpf fish with strong expression in the mid-hindbrain, dorsal spinal cord, myotome, and pectoral fin. W: At 10dpf, Pax3a:GFP can be seen in many cells in the trunk region. |
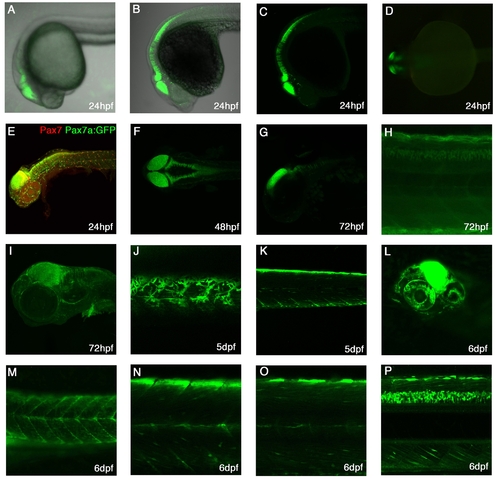
Expression patterns of TgBAC(pax7a:GFP)i131 A-C: Lateral view at 24hpf showing expression in the dorsal midbrain, hindbrain, rhombomeres and dorsal anterior spinal cord. A-live embryo, B- α-GFP stained embryo with brightfield background, C-α-GFP stained embryo. D: Dorsal view of 24hpf live embryo, showing expression in the mid-hindbrain. E: Lateral view of a 24hpf pax7a:GFP embryo stained with Pax7 mAb shows expression in the brain areas, cranial neural crest cells and laterally migrating neural crest cells. F: Dorsal view of a 48hpf stained embryo showing expression in dorsal CNS. G: Lateral view of a 72hpf embryo with expression in the dorsal mid-hindbrain and in the rhombomeres. H: Lateral view of a medial trunk section showing expression in the dorsal spinal cord at 72hpf. I: Lateral view of a 72hpf embryo with expression in cranial neural crest cells, the brain and the pectoral fin. J: Lateral superficial view of the trunk in a 5dpf larvae with pigments cells, the xanthophores, clearly visible. K: Lateral view of a medial section of the trunk showing a bright dorsal neural crest cell and myotomal expression. L: At 6dpf, expression is strongly visible in the midbrain and in the eye. M-P: At 6dpf, expression in the trunk is visible in pigment cells (M), myotomal cells (M-O), in dorsal neural crest cells(Baroffio et al.) and brightly in the dorsal spinal cord(P). |
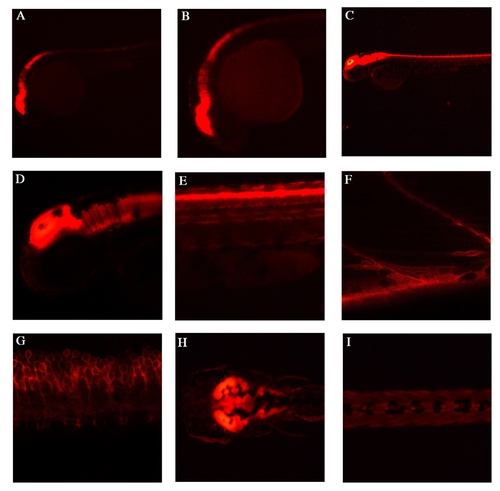
Endogenous lyn-dt-tomato expression patterns of TgBAC(pax7a:lyn-tom)7-65 A,B: Lateral view at 24hpf, shows strong expression in the mid-hindbrain regions, as well in the dorsal spinal cord. C-E: Lateral view at 48hpf, shows expression in mid-hindbrain and in dorsal spinal cord. F: At 5 dpf, high magnification view of a lateral somite shows a single pax7+ve cell and a myofibre with lyn-dt-tomato perdurance in the myotome. G: At 5 dpf, a lateral view of spinal cord cells shows the outline of the cells through the lyn tag. H: A dorsal view at 5 dpf shows strong expression in the mid-hindbrain. I: At 5dpf a the dorsal view of the trunk shows some neural crest cells. |
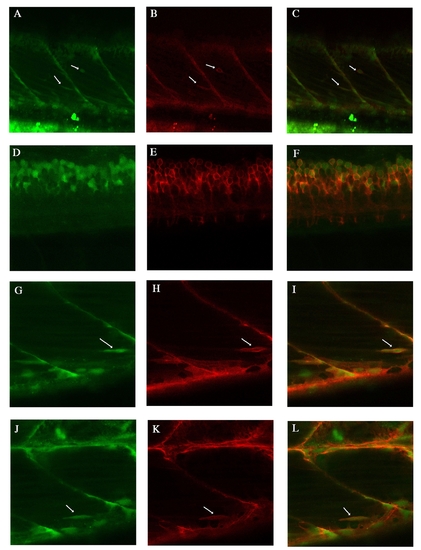
Endogenous lyn-dt-tomato and GFP expression patterns of TgBAC(pax7a:lyn-tom)7-65 and TgBAC(pax7a:GFP)i131 at 5 dpf A-C: Two Pax7 positive cells are visible (arrows). pax7a:lyn-dt-tomato beautifully labels the cell membrane, whereas the pax7a:GFP is visible in the inside of this cell. D-F: At spinal cord level, the pax7a:lyn-dt-tomato labels the membrane of all the pax7a:GFP positive cells. G-L: Another two examples of individual cells labelled by both the lyn-dt-tomato and the GFP (arrows). H same image at in Suppl.Fig.5F. |