
|
Fig. S4
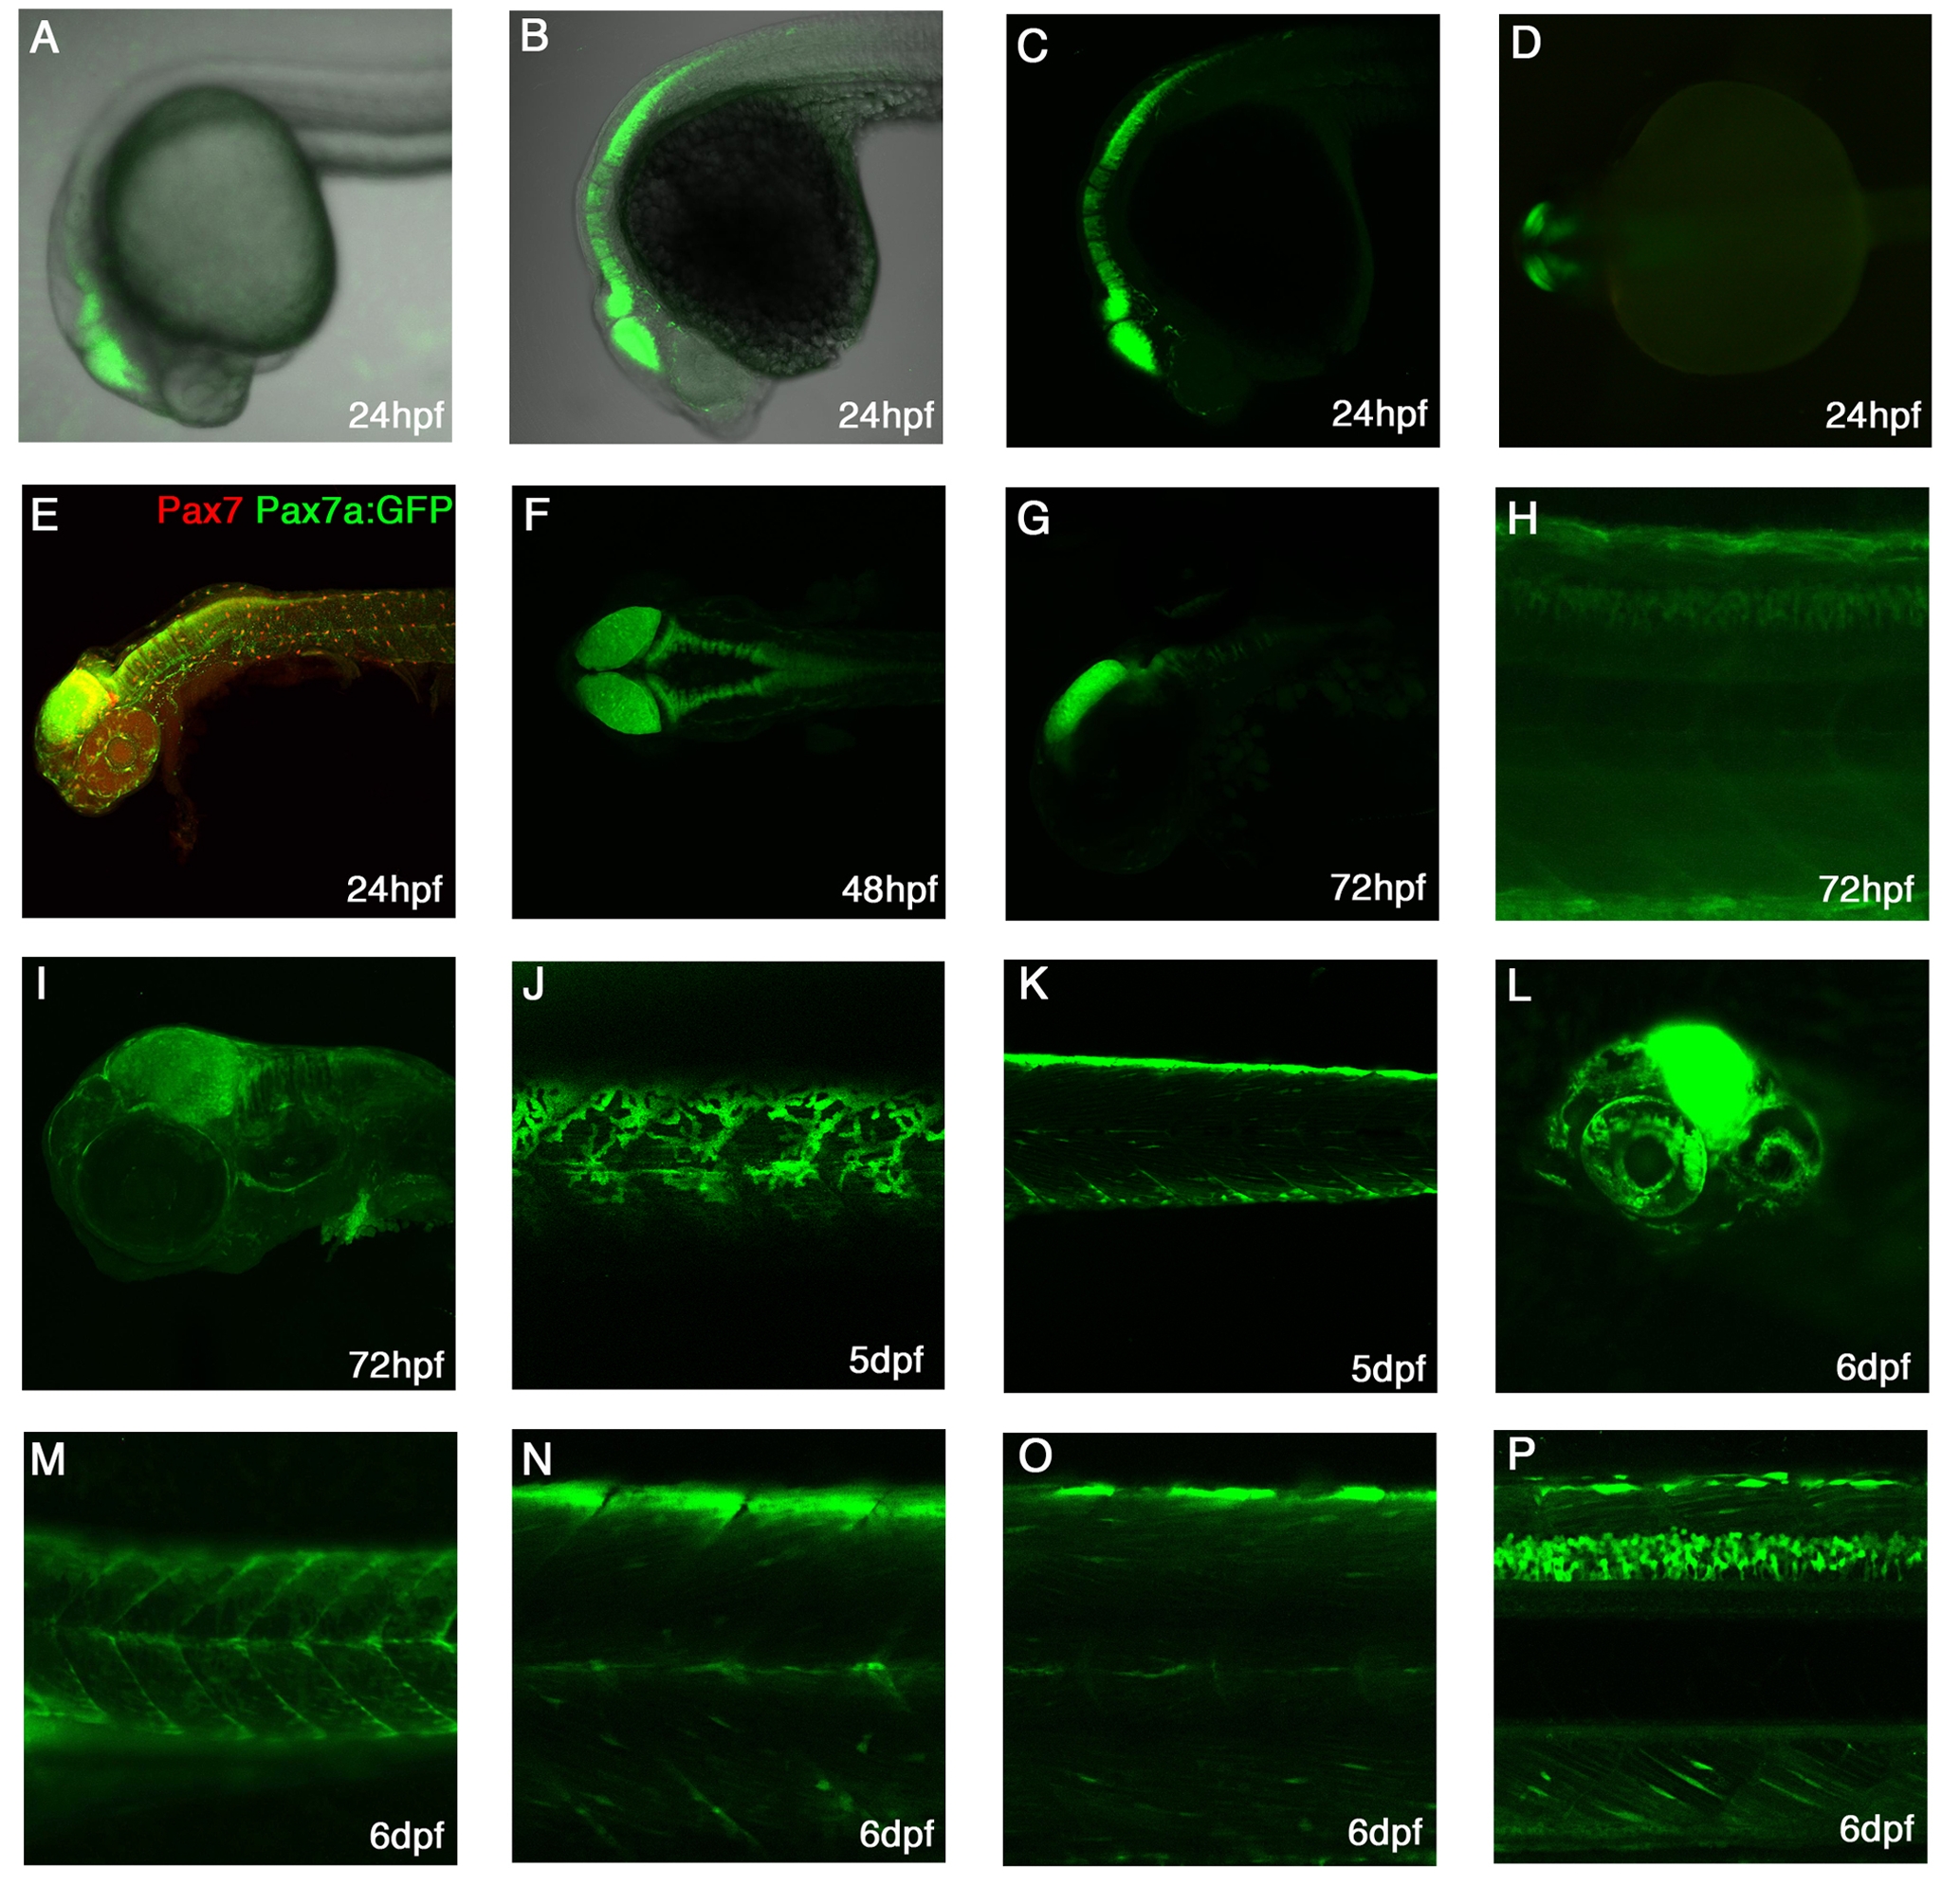
Expression patterns of TgBAC(pax7a:GFP)i131
A-C: Lateral view at 24hpf showing expression in the dorsal midbrain, hindbrain, rhombomeres and dorsal anterior spinal cord. A-live embryo, B- α-GFP stained embryo with brightfield background, C-α-GFP stained embryo.
D: Dorsal view of 24hpf live embryo, showing expression in the mid-hindbrain.
E: Lateral view of a 24hpf pax7a:GFP embryo stained with Pax7 mAb shows expression in the brain areas, cranial neural crest cells and laterally migrating neural crest cells.
F: Dorsal view of a 48hpf stained embryo showing expression in dorsal CNS.
G: Lateral view of a 72hpf embryo with expression in the dorsal mid-hindbrain and in the rhombomeres.
H: Lateral view of a medial trunk section showing expression in the dorsal spinal cord at 72hpf.
I: Lateral view of a 72hpf embryo with expression in cranial neural crest cells, the brain and the pectoral fin.
J: Lateral superficial view of the trunk in a 5dpf larvae with pigments cells, the xanthophores, clearly visible.
K: Lateral view of a medial section of the trunk showing a bright dorsal neural crest cell and myotomal expression.
L: At 6dpf, expression is strongly visible in the midbrain and in the eye.
M-P: At 6dpf, expression in the trunk is visible in pigment cells (M), myotomal cells (M-O), in dorsal neural crest cells(Baroffio et al.) and brightly in the dorsal spinal cord(P).