
- Title
-
Differentiated skeletal cells contribute to blastema formation during zebrafish fin regeneration
- Authors
- Sousa, S., Afonso, N., Bensimon-Brito, A., Fonseca, M., Simões, M., Leon, J., Roehl, H., Cancela, M.L., and Jacinto, A.
- Source
- Full text @ Development
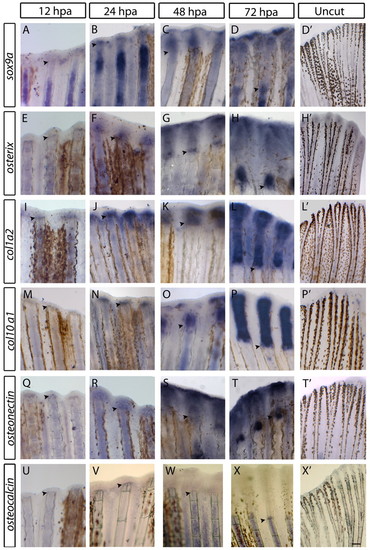
Expression of skeletogenesis genes during early stages of caudal fin regeneration. (A-X2) Whole-mount in situ hybridisation of (A-D2) sox9a, (E-H2) osterix, (I-L2) col1a2, (M-P2) col10a1, (Q-T2) osteonectin and (U-X2) osteocalcin at 12, 24, 48 and 72 hpa and in uncut specimens in the distal region of the fin. Scale bars: 100 μm in regenerating fins and 200 μm in uncut fins. Arrowheads indicate the amputation plane. |
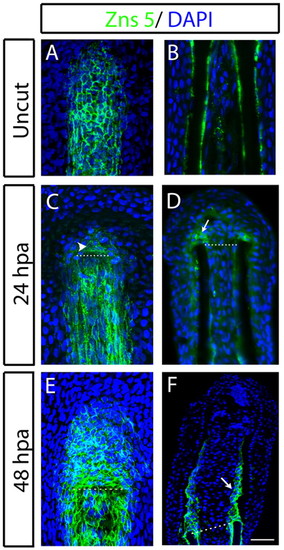
Zns5 expression domains during early stages of fin regeneration. (A-F) Immunostaining with Zns5 antibody in (A,C,E) whole mount and (B,D,F) longitudinal cryosections of (A,B) uncut, (C,D) 24 hpa, (E,F) 48 hpa fins. The arrowhead in C indicates Zns5-positive cells at the blastema. The arrows in D and F indicate aligning scleroblasts. Scale bar: 50 μm (45 μm in B). Dashed lines indicate amputation plane. |
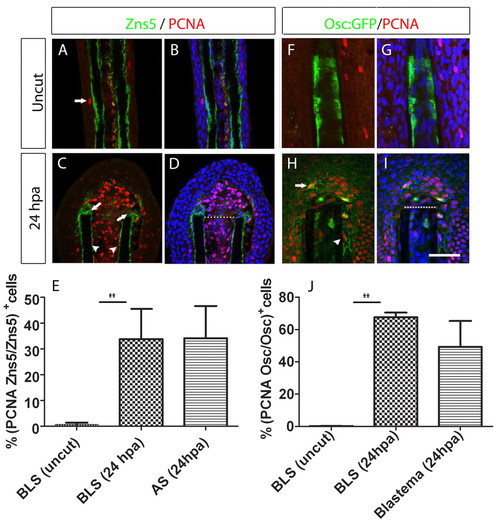
Proliferation of bone-lining cells increases upon amputation of the caudal fin. (A-D) Double immunohistochemistry with PCNA and Zns5 antibody in wild-type fins. (A,B) Uncut and (C,D) 24 hpa fins. (A,C) Zns5 (green) and PCNA (red). (B,D) Zns5 (green), PCNA (red) and DAPI (blue). The arrow in A indicates an proliferating epidermal cell. The arrowheads in C indicate proliferating BLSs and the arrows indicate aligning proliferating scleroblasts. (E) Percentage of the total Zns5-positive cells that were also positive for PCNA in the BLS and AS populations, calculated for the first segment below and above the amputation plane at 24 hpa, and in the equivalent region of uncut fins. There was a significant increase in double-positive BLSs in the 24 hpa samples compared with uncut samples (Student′s t-test, P<0.05; n=5 for each condition). (F-I) Double immunohistochemistry with GFP and PCNA antibody in Tg(osteocalcin:GFP) fins. (F,G) Uncut fin. (H,I) 24 hpa fin. (F,H) osteocalcin:GFP (green) and PCNA (red). (G,I) osteocalcin:GFP (green), PCNA (red) and DAPI (blue). In H, the arrow indicates a proliferating osteocalcin-expressing cell within the blastema; the arrowhead indicates a proliferating osteocalcin-expressing BLS. (J) Percentage of cells double-positive for osteocalcin:GFP and PCNA over the total osteocalcin:GFP-positive cells, in the BLS and blastema populations, calculated for the first segment below and above the amputation plane at 24 hpa, and in the equivalent region of uncut fins. There was a significant increase in double-positive BLSs in the 24 hpa samples compared with uncut samples (Student′s t-test, P<0.05; n=5-8 for each condition). Scale bar: 100 μm in A,B,F-I and 75 μm in C,D. Dashed lines indicate amputation plane. |
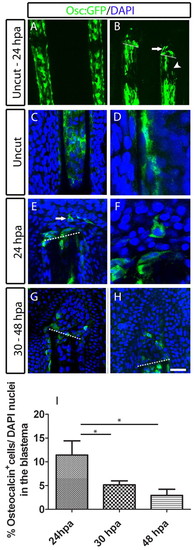
Presence of GFP-positive osteocalcin-reporter cells in the blastema upon amputation of the caudal fin. (A,B) osteocalcin-reporter expression in Tg(osteocalcin:GFP) fins. (A) Uncut fin. (B) 24 hpa fin. The arrow indicates osteocalcin-expressing cells at the blastema and the arrowhead indicates the lack of the osteocalcin reporter expression. (C-H) Immunohistochemistry for GFP in Tg(osteocalcin:GFP) fins. (C,D) Uncut fin. (E,F) 24 hpa fin. The arrow indicates osteocalcin-expressing cell in the blastema. D and F are magnified optical slices of C and E, respectively. (G) 30 hpa fin. (H) 48 hpa fin. (I) Percentage of osteocalcin:GFP-expressing cells over the total DAPI-stained nuclei in the blastema population. There were significantly fewer osteocalcin:GFP-expressing cells at 30 and 48 hpa than at 24 hpa (Student′s t-test, P<0.05; n=11-13 for each condition). Scale bar: 115 μm in A; 100 μm in B; 50 μm in C,E,G,H; 20 μm in D and F. Dashed lines indicate amputation plane. |
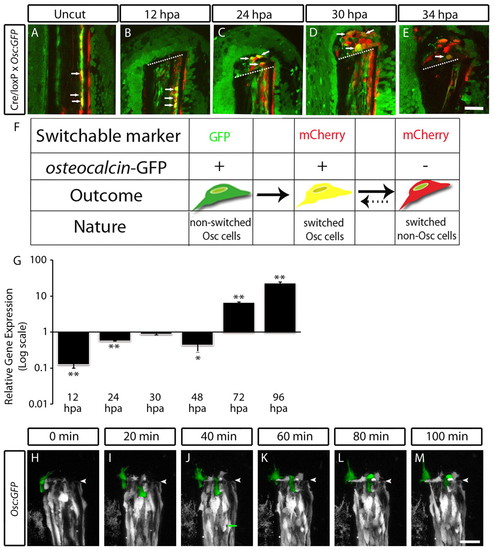
Differentiated scleroblasts from bone lining migrate to integrate in the blastema. (A-E) In vivo confocal images from a double transgenic Tg(eab2:EGFP-T-mCherry; osteocalcin:GFP) fish, injected with Cre mRNA. (A) Uncut fin; the arrows indicate yellow cells in the bone lining to be tracked upon amputation. (B) 12 hpa fin, the arrows indicate tracked yellow cells in the lining of the bone that have become rounder, indicative of their proliferative state. (C) 24 hpa fin; the yellow cells have migrated from the bone lining to the blastema. (D) 30 hpa fin. (E) 34 hpa fin. In D and E, the arrows mark yellow cells that progressively lose GFP expression driven by the osteocalcin promoter and expresses only mCherry. The sequential images (B-F) were taken from the same ray of the same transgenic fish, in total we tracked five animals. The images are a projection of several confocal optical slices. Scale bar: 50 μm in all images. Dashed lines indicate amputation plane. (F) A diagram showing the different possible outcomes of a cell from a double transgenic fish, Tg(eab2:EGFP-T-mCherry; osteocalcin:GFP) injected with Cre mRNA. An osteocalcin:GFP-positive cell in which the switchable marker (eab2:EGFP-T-mCherry) has not been activated is seen as a green cell. However, with the activation, the osteocalcin:GFP-positive cell also expresses mCherry, and is seen as yellow. Then, if the osteocalcin:GFP expression is downregulated the yellow cell can be seen as red. This red cell can turn yellow again when osteocalcin:GFP is re-expressed at 72 hpa (G) qPCR shows that at 12-48 hpa osteocalcin expression decreases compared with uncut fins and that at 72 and 96 hpa this expression increases sixfold and 23-fold, respectively (P<0.05, n=6 for each condition). (H-M) In vivo imaging of Tg(osteocalcin:GFP) from 19 to 20.5 hpa. The interval between each frame is 20 minutes. (H) A single ostecalcin-positive cell, artificially coloured green, is tracked in the subsequent images, I-M (in H the position of this cell was not clear). It is possible to see the cell extending protrusions, changing shape and migrating to integrate in the blastema. Another osteocalcin-positive cell at the bone lining is identified in I and is tracked in sequential images, J-M. The arrow in J indicates a proliferating osteocalcin-positive cell. Scale bar: 50 μm in all images. Arrowheads indicate amputation plane. |
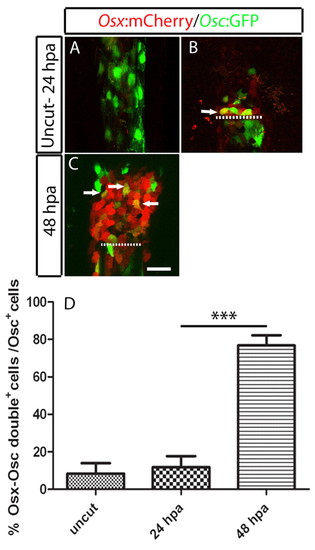
osteocalcin-positive scleroblasts at the blastema start to express de novo osterix, an early marker for skeletal differentiation. (A-C) osterix- and osteocalcin-reporter expression in double Tg(osterix:mCherry; osteocalcin:GFP) fins. (A) Uncut fin. (B) 24 hpa fin. (C) 48 hpa fin. In B and C the arrows indicate cells co expressing osterix and osteocalcin. Each image is a projection of several confocal optical slices. (D) Percentage of double-positive, osterix- and osteocalcin-expressing cells over the total of osteocalcin-expressing cells in the blastema population. There was a significant increase at 48 hpa compared with the uncut and 24 hpa samples (Student′s t-test, P<0.05; n=5 or 6 for each condition). Scale bar: 50 μm. Dashed lines indicate amputation plane. |
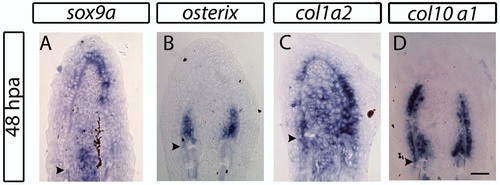
Expression domains of skeletogenesis-associated genes during the early stages of blastema formation. (A-D) In situ hybridization on 48 hpa longitudinal sections showing expression of (A) sox9a, (B) osterix, (C) collagen1a2, (D) collagen10a1. Scale bar: 50 μm. Arrowheads indicate the amputation plane. |
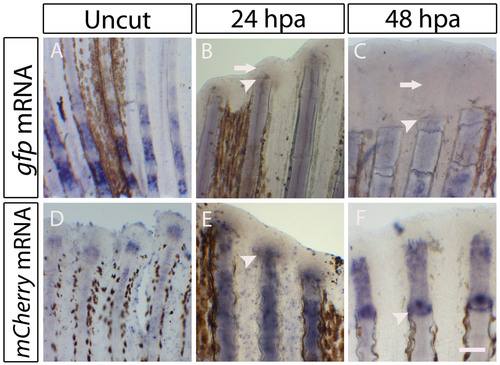
Expression of the reporter genes in the transgenic lines: Tg(osterix:mCherry) and Tg(osteocalcin:GFP) during early stages of caudal fin regeneration. (A-F) Whole-mount in situ hybridization for the reporter genes. (A-C) Detection of gfp mRNA in the Tg(osteocalcin:GFP) fins. (A) Uncut proximal portion of the fin before the fin bifurcation. (B) 24 hpa fin. (C) 48 hpa fin. Arrows in B and C indicate the absence of gfp mRNA at the blastema. (D-F) Detection of mCherry mRNA in the Tg(osterix-mCherry) fins. (D) Uncut distal portion of the fin. (E) 24 hpa fin. (F) 48 hpa fin. Scale bar: 100 μm in regenerating fins; 200 μm in uncut fins. Arrowheads indicate the amputation plane. |
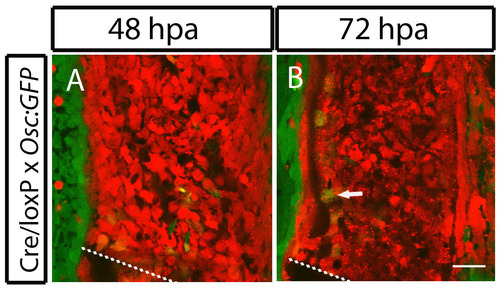
Differentiated scleroblasts from bone lining migrate to integrate in the blastema. (A,B) In vivo confocal images from a double transgenic fish, Tg(eab2:EGFP-T-mCherry; osteocalcin:GFP) injected with Cre mRNA. (A) 48 hpa fin. (B) 72 hpa fin. In B, the arrow indicates a yellow BLS re-expressing osteocalcin at the blastema. Scale bar: 25 μm for all panels. Dashed lines indicate amputation plane. |
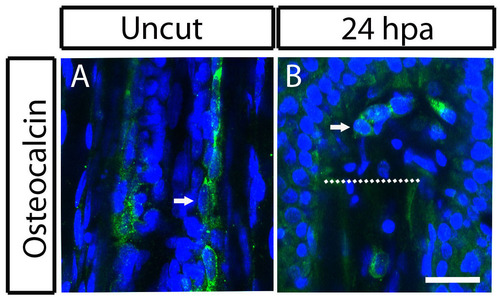
Blastema cells still expresses Osteocalcin 24 hours postamputation of the zebrafish caudal fin. (A,B) Immunohistochemistry for Osteocalcin. (A) Uncut fin. (B) 24 hpa fin. In A, the arrow indicates Osteocalcin-producing bone lining cell. In B, the arrow indicates Osteocalcin-producing cell in the blastema. Scale bar: 50 µm for all panels. Dashed lines indicate amputation plane. |
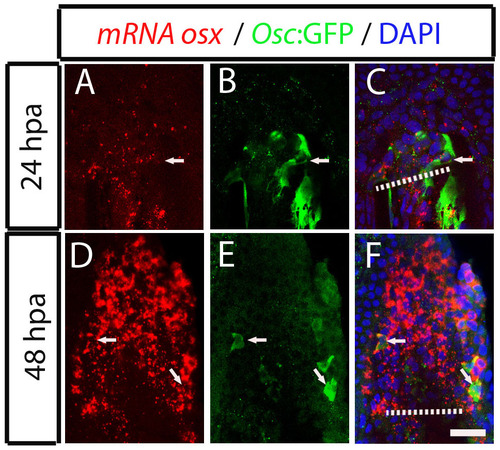
Dedifferentiating osteocalcin-positive scleroblasts at the blastema start to express de novo osterix at 48 hpa. (A-F) Osterix mRNA expression detected by fluorescence in situ hybridization followed by immunohistochemistry against GFP in Tg(osteocalcin:GFP) fins. (A-C) 24 hpa fin. The arrow indicates a osteocalcin-positive cell at the blastema that does not express osterix mRNA, labelled with Fast Red. (D-F) 48 hpa fin. The arrows indicate double positive cells co-expressing osterix mRNA and osteocalcin:GFP. The images are each projections of several confocal optical slices. Scale bar: 50 µm. Dashed lines indicate amputation plane. |
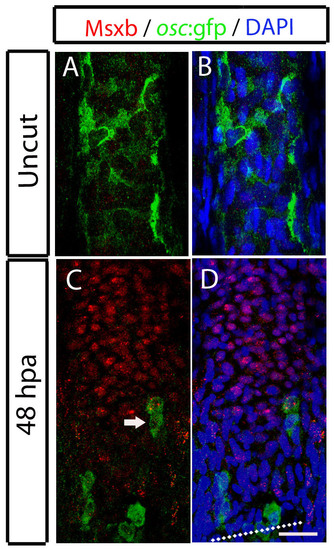
Osteocalcin reporter cells at the blastema do not express Msxb, the marker for the undifferentiated state. (A-D) Immunohistochemistry for osteocalcin:GFP and Msxb protein on 50 μm sagittal sections. (A,B) Uncut fin. (C,D) 48 hpa fin. The arrow in D indicates a osteocalcin-expressing cell that is not positive for Msxb. Scale bar: 50 μm for all panels. Dashed lines indicate amputation plane. |