
Image
|
Figure Caption
Fig. 2
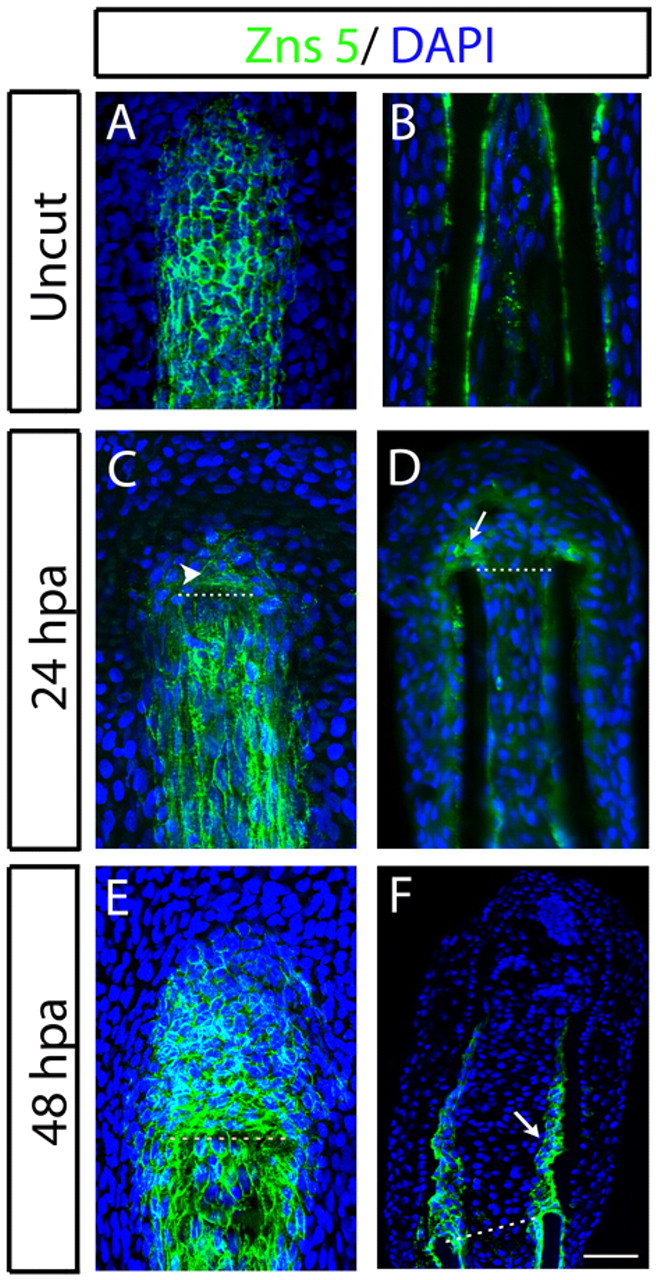
Zns5 expression domains during early stages of fin regeneration. (A-F) Immunostaining with Zns5 antibody in (A,C,E) whole mount and (B,D,F) longitudinal cryosections of (A,B) uncut, (C,D) 24 hpa, (E,F) 48 hpa fins. The arrowhead in C indicates Zns5-positive cells at the blastema. The arrows in D and F indicate aligning scleroblasts. Scale bar: 50 μm (45 μm in B). Dashed lines indicate amputation plane.
Acknowledgments
This image is the copyrighted work of the attributed author or publisher, and
ZFIN has permission only to display this image to its users.
Additional permissions should be obtained from the applicable author or publisher of the image.
Full text @ Development