
- Title
-
Fli+ etsrp+ Hemato-Vascular Progenitor Cells Proliferate at the Lateral Plate Mesoderm during Vasculogenesis in Zebrafish
- Authors
- Chun, C.Z., Remadevi, I., Schupp, M.O., Samant, G.V., Pramanik, K., Wilkinson, G.A., and Ramchandran, R.
- Source
- Full text @ PLoS One
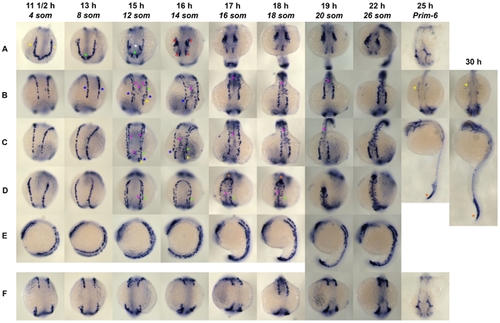
Etsrp Whole Mount In Situ Hybridization. A montage of different embryonic stages starting from 4 som to 30 hpf was captured of DIG-labeled etsrp antisense ISH whole mount embryos. Embryonic stages are described in somites (som) or hours post fertilization (hpf). A, head; B, dorsal; C, trunk; D, tail; E, lateral; F, between head and dorsal view. |
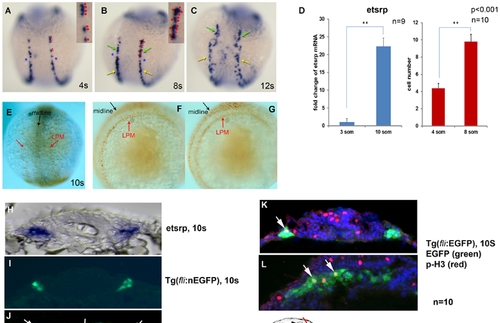
FEVPs proliferate at the LPM. A to C shows dorsal view of etsrp+ cells at 4, 8, and 12 som. Two lateral stripes of etsrp+ cells evenly distributed on either side of the midline at 4s (A). At 8 som, an asymmetric break is noticed (B, blue asterisks) in the cells of LPM resulting in two etsrp+ cell populations that show distinct behavior (B and C, green and yellow arrows). A and B contain insets of etsrp+ cells at LPM marked by red dots, which was quantified in panel D, red bars. (D) show quantitation of etsrp+ cells as indicated by red dots in panel (B) across each stage indicated in the graph. Error bars represent SEM (qPCR, n = 9; cell count, n = 10). Red bars indicate absolute cell number and blue bars indicate etsrp transcript fold change. Samples for analysis were collected at the indicated stages. (E-G) Developing embryos (1 som) were treated with BrdU (10 mM) in embryonic buffer, and subsequent staining was performed with DAB substrate. The BrdU incorporated cells appear in the developing somites at the midline (black arrows) and in the two lateral stripes of etsrp+ cells at the LPM (red arrows) in E, F, and G. We confirmed the identity of BrdU+ cell at 10 som by ISH with etsrp AS probe (H), immunostaining of GFP in Tg(fli1a:nEGFP) embryos (I) and EdU incorporation assay (J) post 10 μm cross-section of the embryos at 10 som. White arrows in J show EdU+ cells at 10 som. (K) and (L) shows double immunostaining sections of Tg(fli1a:EGFP) 10 som embryos stained for EGFP (green), and phospho-histone H3 antibody (p-H3, red). Arrows indicate merged yellow cells stained for both markers. Blue color is from DAPI staining. Cartoon of 10 som embryos with different section plains for panels H-L are indicated. |

Notch signaling pathway plays a role in FEVPs proliferation at the LPM. Loss of grl function by morpholino injection is shown in panels (A) to (D). Panels (A) and (D) are grl MO injected, panels (B) and (C) are uninjected fish, and panel C2 is control MO injected fish. In panels (A) and (B), still images of Tg(fli1a:EGFP) grl-MO injected (A) or (B) uninjected Tg(fli1a:EGFP) 16 som embryos are shown. These images were part of a series of images that were taken under a fluorescence microscope at every 10 min from 15 to 21 hpf, which was reconstituted to movie clips (Movie S1 & S2). The grl-MO injected (A) clearly shows fewer fli+ cells at 16 som. The same embryo group was also subjected to phospho-histone H3 antibody staining at 10 som (C & D). E shows quantification of number of phospho-histone H3+ cell at midline (C: center = inside 50 µm bar) in uninjected (UI, dark blue bar), control MO (cont-MO, green bar), gridlock MO (grl MO, light blue bar), and in the same samples at LPM (P: periphery = outside 50 µm bar). Error bars represent SEM (n = 8). NS - not significant and ** p<0.001. (F-H) are control MO-injected, Su(H)DBM (a gridlock blocker) mRNA-injected and notchICD mRNA injected embryos stained for etsrp at 10 som. The Su(H)DBM mRNA-injected embryo shows dramatic reduction of etsrp+ cells at 10 som (F) while notchICD mRNA injected embryo (H) shows induction of etsrp+ cells at 10 som compared to uninjected embryo (G). (I) qPCR analysis showed that KD of grl by MO or dominant negative (Su(H)DBM) approach resulted in reduction of transcript level of etsrp but not vegf and actin (Error bar is SEM, n = 3, p<0.001). (J-N) Embryos treated with indicated chemicals from 10-14 hpf, subjected to whole mount ISH for scl and etsrp markers, and flat mounted. (J-L) ISH for scl in posterior LPM of embryos treated with vehicle control DMSO (J) or the γ -secretase inhibitors DAPT (K) or WPE-III-31C [17] (L). Bracket indicates the midline convergence segment of the gamma loop of Gering et al. [54] The posterior scl expression domain is thickened, and expanded anteriorly in embryos treated with γ-secretase inhibitors. (M-N) ISH for etsrp in posterior LPM of embryos treated with vehicle control DMSO (M) or DAPT (N). Etsrp expression domain is expanded anteriorly. (O-P) Dorsal view of Su(H)DBM mRNA- injected embryo at 16 som (P) showed dramatic mispatterning of flk+ cells in trunk compared to that of uninjected embryo (O). (See also Figure S1 and Movie S1 and Movie S2). The numbers on the top right panel of all ISH embryos in this figure indicate number of embryos out of total number displaying that particular phenotype. |
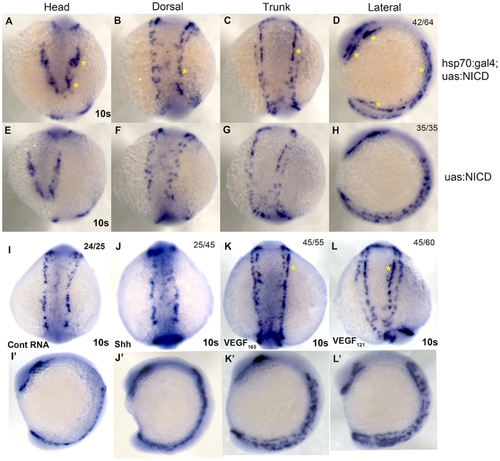
Shh-VEGF-Notch-Hey2 signaling pathway regulates FEVPs proliferation at the LPM. Etsrp WISH was performed on Tg(hsp70:gal4;uas:NICD) and Tg(uas:NICD) embryos. A-H shows etsrp+ cells of Tg(hsp70:gal4;uas:NICD) and Tg(uas:NICD) embryos in head, dorsal, trunk, and lateral. Temporal expression of NICD at 1 som resulted in induction of etsrp+ cells at 10 som. I to L show dorsal view of etsrp+ cells in uninjected (I), shh (J), vegf165 (K) and vegf121 (L) mRNA-injected embryos in trunk at 10 som. I2-L2 show lateral view of the 10 som etsrp WISH embryos. Vegf165 mRNA (K) injected embryo shows more etsrp+ cells in outer line (yellow asterisk) and vegf121 mRNA (L) injected embryos in inner line (asterisk). (See Figure S2 and S3). The numbers on the top right panel of all ISH embryos in this figure indicate number of embryos out of total number displaying that particular phenotype. |
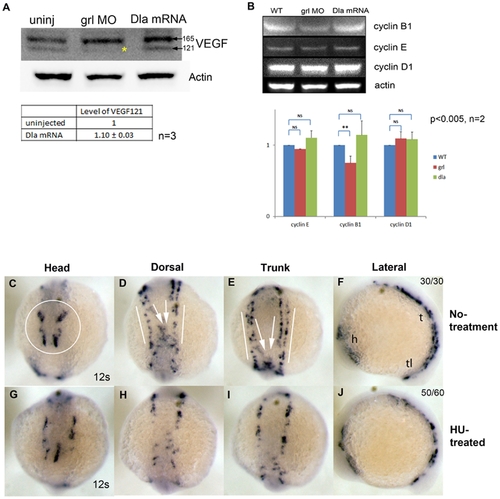
Cell cycle analysis in 10 som embryos. (A) Overexpression of deltaA mRNA and KD of grl shows complementary changes in protein levels for VEGF121 at 10 som. (B) Western blot analysis using total protein from uninjected, grl MO, and deltaA mRNA-injected embryos showed reduction of cyclin B1 in grl MO injected embryos, and slight induction of cyclin B1 in deltaA mRNA-injected embryos. No change was observed in cyclin E and D1 levels in deltaA mRNA or grl MO-injected embryos. The graph shows quantitation of the western blots with error bars representing SEM (n = 2, p<0.005). (C-J) These panels compare hydroxyurea (HU)–treated (G-J) embryos to untreated embryos (C-F). Treatment of HU, cell cycle inhibitor from 1 to 10 som embryos resulted in reduction of etsrp+ cells at the LPM (G-J) at 12 som. In untreated embryos, normal etsrp expression patterns were shown as four sets of etsrp+ cells in head (C, circle), migrating (D and E, white arrows) and stationary (D and E, white lines) etsrp+ cells in dorsal and trunk. h, head; t, trunk; tl, tail in N. (See also Figure S4 and Figure S6). The numbers on the top right panel of all ISH embryos in this figure indicate number of embryos out of total number displaying that particular phenotype. |

A montage of grl whole mount ISH from 8 som to 18 som embryos is shown in panels A-D. A (head), B (trunk) and C (tail) are dorsal views and D (full embryo) is lateral view. The grl expression is observed at 10–12 som at the LPM. This expression is however appears medial and not as lateral as etsrp marker. The expression in the midline starts at 16 som and continues until 18 som. The grl expression resembles flk expression (data not shown) at 17 som and the expression is also seen in axial vessels at this stage. |

A-F are whole mount Shh ISH embryos at 10 som (A, D), 3 som (B, E) and bud (C, F) embryonic stage with expression noticed at midline in all stages. (A-C) is lateral view and, (D-F) is dorsal view. (G-H) are whole mount vegf ISH at 10 som. Inset in G shows the vegf expression in endoderm (e) adjoining the yolk and somite (s). I is immunostaining of 10 som section for VEGF protein. Yellow arrow indicates hypochord staining of VEGF protein. |
Whole mount ISH with myod probe was performed in 10 som uninjected embryos (A, G) or embryos injected with reagents that are indicated in the panels. A-F is dorsal whole mount ISH view, and G-L is lateral whole mount ISH view. |

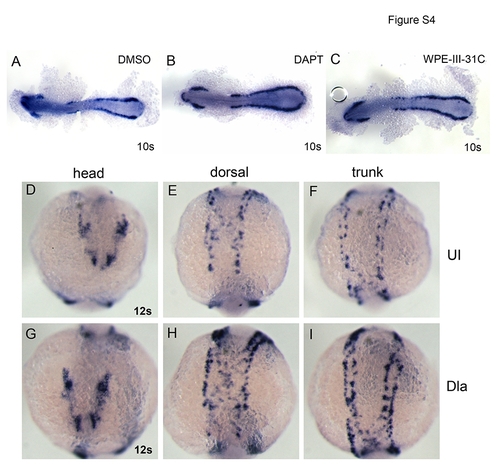
Whole mount ISH with etsrp AS probe was performed in DMSO (A) and notch inhibitors (B: DAPT or C: WPE-III-31C) embryos at 10 som. Images show the entire embryo at lower magnification. Similarly, etsrp ISH embryos for uninjected and deltaA mRNA-injected embryos are shown in panels D-I. D to F shows etsrp+ angioblasts in uninjected, and G to I shows induction of etsrp+ angioblasts in deltaA mRNA-injected 12 som embryo in head, dorsal, and trunk. |
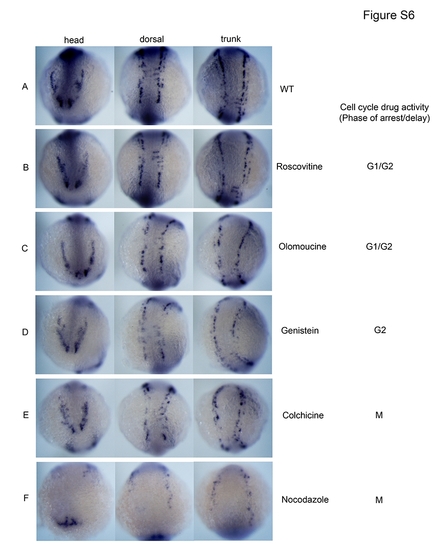
Chemical treated embryos at 1 som (10 hpf) were subjected to etsrp ISH at 10 som. Doses and description of inhibitors were based on previous studies in zebrafish [5]. (A) wild type (WT) untreated embryo, (B) Roscovitine, (C) Olomoucine, (D) Genistein, (E) Colchicine, and (F) Nocodazole treated embryo. The cell cycle activity profile for each drug is indicated to the right of each panel |