
- Title
-
Dynamic smad-mediated BMP signaling revealed through transgenic zebrafish
- Authors
- Collery, R.F., and Link, B.A.
- Source
- Full text @ Dev. Dyn.
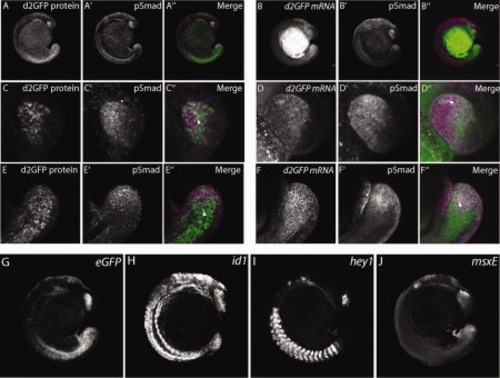
Figure 2. Expression of bone morphogenic protein response element: destabilized enhanced green fluorescent protein (BRE:d2GFP) protein and mRNA, and phospho-Smad1/5/8 immunoreactivty in 13- to 17-somite embryos. A–F: Whole embryos were imaged for both d2GFP protein (A,C,E) and mRNA (B,D,F; green) and phospho-Smad1/5/8 immunoreactivity (magenta) (A2–F2). Note the enriched and overlapping d2GFP and phospho-Smad1/5/8 immunoreactivity in the tail and lower trunk regions. Higher magnification images of the tail bud region showed colocalization of d2GFP protein and mRNA and phospho-Smad1/5/8 immunoreactivity in some cells (arrowheads), although others expressed only d2GFP protein or mRNA, or phospho-Smad1/5/8. G–J: Expression of transcripts for known BMP-regulated targets id1, hey1, and msxE (H–J) were found in regions associated with the BRE promoter (G). |
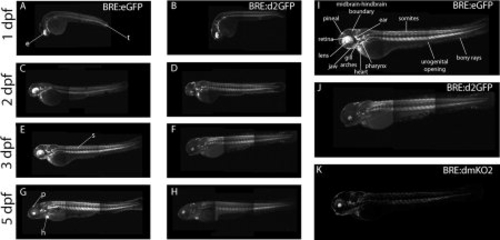
Figure 3. Expression of enhanced green fluorescent protein (eGFP), destabilized eGFP (d2GFP), or Kusabira-Orange 2 (KO2)-PEST driven by the bone morphogenic protein response element (BRE) promoter lines during larval development. A,C,E,G: The BRE:eGFP was expressed in the dorsal developing eye (e), somites (s), tail (t), heart (h) and pineal (p) during the first 5 days post fertilization. B,D,F,H: Similarly, d2GFP was found in the same areas, but at lower levels. I–K: Annotated expression of enlarged view of 3 dpf BRE:eGFP transgenic zebrafish larvae (I), BRE:d2GFP transgenic zebrafish larvae (J), and BRE:KO2-PEST transgenic zebrafish larvae (K). Montaging artifacts are visible in the trunk region at the border of adjacent image frames. |
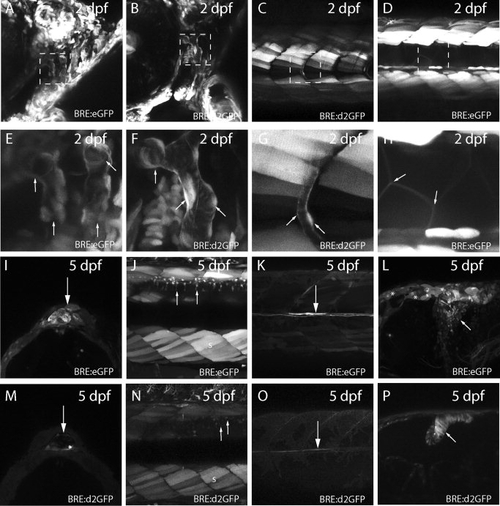
Figure 4. Diverse tissue expression of enhanced green fluorescent protein (eGFP) or destabilized eGFP (d2GFP) in bone morphogenic protein response element (BRE) transgenic lines. A: Expression of eGFP in cranial vasculature of 2 day postfertilization (dpf) BRE:eGFP larvae. B: Similar expression of d2GFP in 2 dpf cranial vasculature of BRE:d2GFP larvae. C: Expression of d2GFP in intersomitic vasculature of 2 dpf BRE:d2GFP larvae. D: Expression of eGFP in 2 dpf somite muscle cells and underlying notochord cells of BRE:eGFP larvae. E–H: Higher magnification of boxed regions in A–D. Arrows indicate the vascular structures in E, F, and G, and the somite muscle cells in H. I: Expression of eGFP in pineal cells of 5 dpf BRE:eGFP larvae (arrow). J: Expression of eGFP in somite muscle (s) and dorsal spinal neurons (arrows) of 5 dpf BRE:eGFP larvae. K: Expression of eGFP in medial longitudinal fasciculus axons (arrow) of 5 dpf BRE:eGFP larvae. L: Expression of eGFP in midbrain–hindbrain neurons (arrow) of 5 dpf BRE:eGFP larvae. Note the ependymal cells that are also weakly eGFP-positive (asterisks). M: Expression of d2GFP in pineal cells of 5 dpf BRE:d2GFP larvae (arrow). N: Expression of d2GFP in somite muscle (s) and dorsal spinal neurons (arrows) of 5 dpf BRE:eGFP larvae. O: Expression of d2GFP in medial longitudinal fasciculus axons (arrow) of 5 dpf BRE:d2GFP larvae. P: Expression of d2GFP in hindbrain neural progenitor cells (arrow) of 5 dpf BRE:d2GFP larvae. |

Figure 5. Bone morphogenic protein response element:enhanced green fluorescent protein (BRE:eGFP) in adult fish. A: eGFP expression viewed in whole fish. B: Dissected kidney showing eGFP expression. C,D: Higher magnification of proximal(C) and distal (D) regions (white brackets) |

Figure 6. Expression of enhanced green fluorescent protein (eGFP) in regenerating fins of bone morphogenic protein response element:eGFP (BRE:eGFP) adult fish. A–F: BRE:eGFP expression in adult caudal fins before and during regeneration. Times post-amputation are indicated above each image. Note that BRE:eGFP expression is increased in the regenerating fin tissue following amputation. G: Magnified view of 7 day post-amputation blastemal cells. H–N: Corresponding transmitted light images are shown below. |
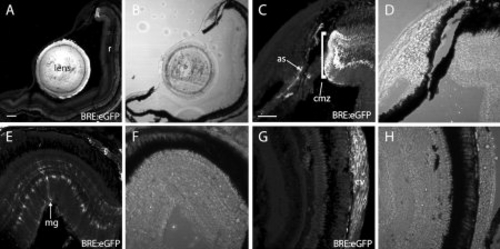
Figure 7. Adult ocular bone morphogenic protein response element:enhanced green fluorescent protein (BRE:eGFP) expression revealed in cryosections. A: BRE:eGFP expression was obvious in the lens and dorsal ciliary margin, but not in the central retina (r). B: Transmitted light image of A. C: BRE:eGFP expression in the ciliary marginal zone (cmz) and anterior stromal and vascular cells (as, arrows). D: Transmitted light image of C. E: BRE:eGFP expression in dorsal retina showing Müller glia (mg) and scleral cells (s). F: Transmitted light image of E. G: BRE:eGFP expression in central retina showing choroidal rete vascular cells (cv). Note the lack of glial expression in the central retina. H: Transmitted light image of G. Scale bars = 200 μm in A,B, 50 μm in C–H |
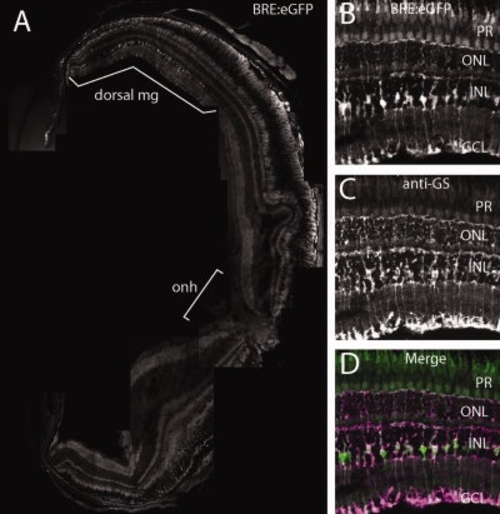
Figure 8. BRE:eGFP expression in adult dorsal Müller glia. A: Central transverse cryosection of an adult bone morphogenic protein response element:enhanced green fluorescent protein (BRE:eGFP) eye. Note that the lens was not imaged as part of the montage. Müller glia (mg); optic nerve head (onh). Region showing eGFP-positive Müller glia is indicated with a white bracket. B: Higher magnification of BRE:eGFP in dorsal Müller glia. C: Expression of glutamine synthetase immunoreactivity (anti-GS), a Müller glia marker, in the same section as B. D: Colocalization of B and C. |
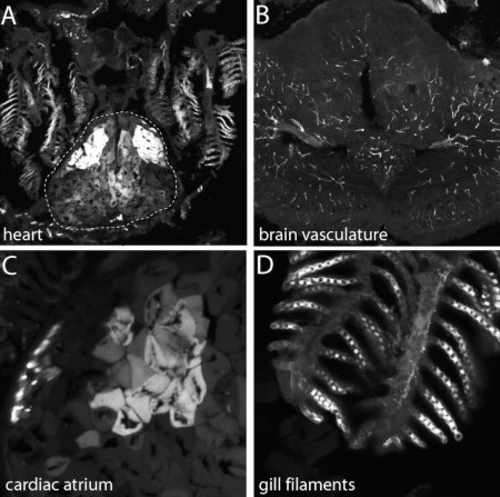
Figure 9. Bone morphogenic protein response element:enhanced green fluorescent protein (BRE:eGFP) expression in adult tissues revealed through cryosections. A: BRE:eGFP expression in the atrium and ventricle of the heart (dotted line) and in the gill filaments. B: BRE:eGFP expression in the vasculature of the brain. C,D: Higher magnification images of the (C) cardiac atrium and (D) gill filaments. |
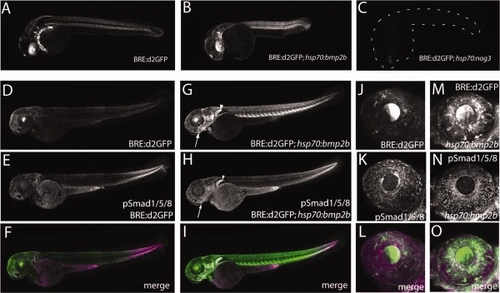
Figure 10. Destabilized enhanced green fluorescent protein (d2GFP) levels are altered when BMP activity is manipulated. A–C: Overexpression of Bmp2b (B) driven by the inducible hsp70 heat-shock promoter increases d2GFP expression levels relative to endogenous BRE:d2GFP in control larvae (A) at 24 hpf when imaged 6 hours after a 30 minute heat shock at 37°C. Note the loss of the dorsal high-ventral low gradient pattern in the eye which is replaced by a uniformly high level of d2GFP expression. Conversely, inhibition of BMP signaling by hsp70 overexpression of Noggin3 downregulates d2GFP expression (C). The embryo position is indicated by dashed lines. D–I: At 3 dpf, overexpression of Bmp2b increases both d2GFP and pSmad1/5/8 immunoreactivity relative to normal levels, particularly in the jaw (arrow) and pectoral fin (arrowhead). J–O: In the 3 dpf eye, Bmp2b overexpression increased d2GFP expression and pSmad1/5/8 immunoreactivity. |
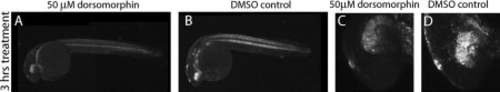
Figure 11. Destabilized enhanced green fluorescent protein (d2GFP) expression driven by the bone morphogenic protein response element (BRE) promoter is down-regulated by dorsomorphin. A–D: Larvae expressing BRE:d2GFP were treated with dimethyl sulfoxide (DMSO) as a control (B,D) or with 50 μM dorsomorphin (A,C) at 24 hpf for 3 hr. The d2GFP expression was reduced, particularly in the head and eye following treatment. Original magnification: ×10 in A,B; ×40 in C,D. |

Supp. Fig. S2. A–F: Treatment of 13- to 17-somite embryos with 50 μM dorsomorphin, or dimethyl sulfoxide (DMSO) control, for 3 hr down-regulates mRNA levels of bone morphogenic protein (BMP) -regulated genes by varying degrees: strongly, id1 (A,D); moderately, msxE (B,E); no observed change, hey1 (C,F). |