
- Title
-
Epithelial cell proliferation in the developing zebrafish intestine is regulated by the Wnt pathway and microbial signaling via Myd88
- Authors
- Cheesman, S.E., Neal, J.T., Mittge, E., Seredick, B.M., and Guillemin, K.
- Source
- Full text @ Proc. Natl. Acad. Sci. USA
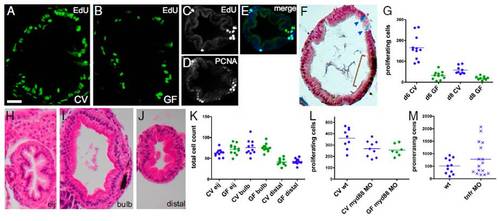
Microbes induce epithelial cell proliferation in the zebrafish larval intestine via Myd88 and not inflammation. Transverse sections of the intestinal bulb of 6-dpf larvae reared CV (A) or GF (B) labeled with EdU to reveal S-phase cells are shown. A transverse section of the distal intestine shows colocalization of EdU-labeled (C) and PCNA-labeled (D) cells (E, merge). (F) Distinct cell populations are stained with Alcian blue, marking differentiated goblet cells (arrowheads), and anti-PCNA, marking mitotic cells (brown bracket). (G) Total numbers of S-phase cells over 30 serial sections in the intestinal bulb of individual 6-dpf larvae are represented for the treatment groups and genotypes indicated. Here and in subsequent figures, the genotype and microbial exposure of each larva are indicated by the shape and color of the data point, respectively. Significantly fewer BrdU-labeled cells were found in 6- and 8-dpf larvae reared GF vs. CV (P < 0.001). H&E sections of 8-dpf GF intestines at three locations within the intestinal tract are shown: the esophageal intestinal junction (H, eij), defined as position 0; the bulb, 30 sections caudal to the junction (I); and the distal intestine, 60 sections caudal to the junction (J). (K) There was no significant difference between total intestinal epithelial cell counts at the three positions described above in 8-dpf CV vs. GF larvae. (L) Significantly fewer EdU-labeled cells were found in CV or GF myd88 MO vs. CV WT (wt) (P < 0.05). (M) There was no significant difference in the numbers of EdU-labeled cells between CV vs. GF myd88 MO or between wt vs. tnfr MO. (Scale bars: A and B, 15 μM; C–F and H–J, 25 μM.) |
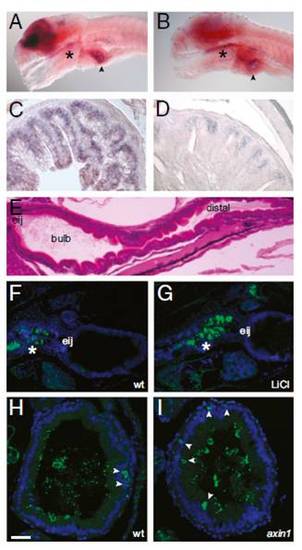
Wnt signaling occurs in the larval zebrafish intestine. (A) In situ hybridization with a tcf4 probe reveals strong brain expression as well as signal in the pharynx (*) and intestinal bulb (arrowhead) in a 6-dpf larva. (B) In situ hybridization with a sox9b probe reveals expression in the brain, pharynx (*), and intestinal bulb (arrowhead) of a 6-dpf larva. Sections of adult proximal intestine displaying expression of tcf4 (C) and sox9b (D) are shown. (E) H&E sagittal section of a 5-dpf larva showing the location of the esophageal intestinal junction (eij), bulb, and distal intestine. Sagittal sections of 6-dpf untreated (F) and LiCl-treated (G) larvae show β-catenin expression (green) in the pharynx and esophagus (*). Nuclei are stained with DAPI (blue). Transverse sections through the intestinal bulb of 6-dpf WT (wt) (H) and axin1 mutant (I) larvae show scattered cells with cytoplasmic β-catenin staining (green, arrowheads). Luminal microbes cross-react with the anti-β-catenin antisera. Nuclei are stained with Torpo (blue). (Scale bars: A and B, 100 μM; C and D, 25 μM; E–G, 50 μM; H and I, 15 μM.) |
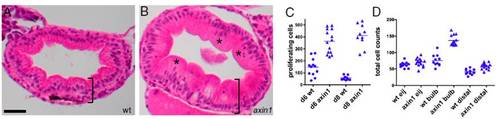
Up-regulation of Wnt signaling causes intestinal hyperplasia. (A) H&E-stained section of an 8-dpf WT (wt) intestinal bulb shows an orderly array of cells in the intestinal epithelium. (B) An 8-dpf axin1 mutant intestine is thicker (bracket) and has more disorganized epithelial cells (*). (C) At both 6 and 8 dpf, axin1 mutants have significantly more BrdU-labeled cells within the intestinal epithelium than wt (P < 0.0001). (D) At 8 dpf, axin1 mutant intestines have significantly more epithelial cells in the bulb and distal intestine vs. wt (P < 0.0001). (Scale bar: A and B, 25 μM.) 4 |
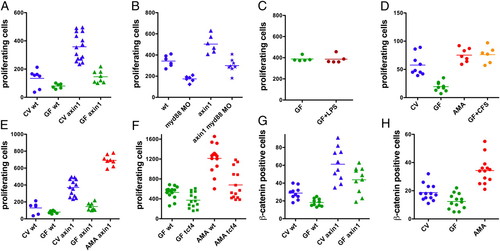
Combinatorial effects of microbial and Wnt signaling on intestinal epithelial cell proliferation. (A-F) S-phase intestinal epithelial cells were quantified in 30 serial sections in the intestinal bulb of individual larvae as in Fig. 1. To label S-phase nuclei, the experiments in A and D used BrdU and the experiments in B, C, E, and F used EdU. All experiments were performed with 6-dpf larvae except the experiment in D, which was performed with 8-dpf larvae. (A) CV axin1 had significantly more proliferating intestinal cells than CV WT (wt), GF wt, and GF axin1 (P < 0.0001). GF axin1 had significantly more proliferating cells than GF wt (P < 0.01). (B) axin1 had significantly more proliferating cells than wt, myd88 MO, and axin1 myd88 MO (P < 0.001). axin1 myd88 MO had significantly more proliferating cells than myd88 MO (P < 0.001). (C) Exposure of GF larvae from 3 to 6 dpf to 30 µg/mL LPS caused no change in cell proliferation relative to untreated GF larvae. (D) Monoassociation of GF larvae with A. veronii (AMA) or treatment with 500 ng/mL A. veronii CFS induced a significant increase in intestinal cell proliferation relative to GF (P < 0.0001). (E) axin1 mutants monoassociated with A. veronii had significantly more proliferating cells than CV axin1 (P < 0.0001). (F) tcf4 mutants had significantly fewer dividing intestinal cells than wt siblings when reared GF (P < 0.01) and when monoassociated with A. veronii (P < 0.0001). Intestinal epithelial cells with cytoplasmic β-catenin were quantified in 30 serial sections in the intestinal bulb of 6-dpf larvae. (G and H) CV wt larvae had significantly more β-catenin-positive cells than GF wt larvae (P < 0.05). (G) CV axin1 had significantly more β-catenin-positive cells than GF axin1 (P < 0.05). (H) A. veronii monoassociated larvae had significantly more β-catenin-positive cells than CV animals (P < 0.0001). PHENOTYPE:
|
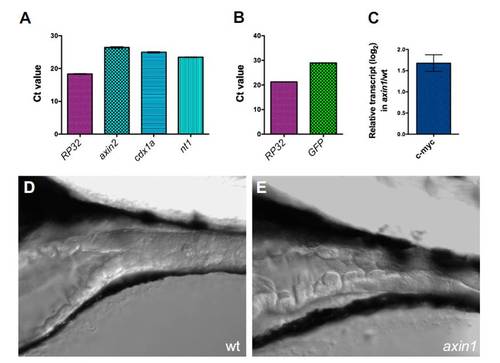
Wnt signaling occurs in the larval zebrafish intestine. Amplification of Wnt target genes and reporter from 6 dpf WT (A) and topD (B) larvae. The relative cycle threshold (Ct) values for a housekeeping gene (rp32) and the indicated Wnt target genes axin1, cdx1a, and nt1 (A) or the gfp reporter (B) are shown. The mean and SD of three triplicate reactions are shown. For all primer pairs, a no-template control reaction yielded no detectable product (i.e., Ct = 40). (C) Relative abundance (log2) of c-myc amplified from axin1 vs. WT (wt) 6-dpf larval intestines is shown. Levels of c-myc were normalized to levels of rp32 for each sample. Error bars represent upper and lower limits, based on the SD of the ΔCt values. (D and E) Intestines of live 6-dpf wt and axin1 larvae. The axin1 intestine appeared thicker and more convoluted. PHENOTYPE:
|