
- Title
-
The ziwi promoter drives germline-specific gene expression in zebrafish
- Authors
- Leu, D.H., and Draper, B.W.
- Source
- Full text @ Dev. Dyn.
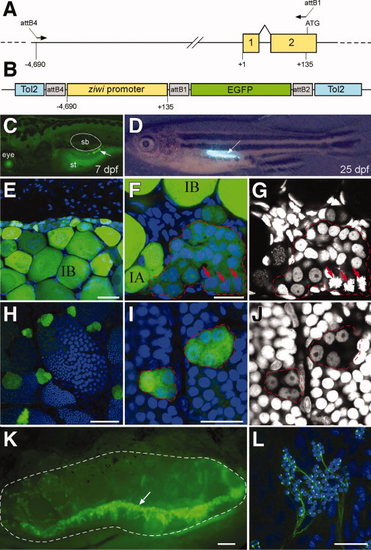
Identification of the ziwi promoter. A: The structure of the 52 region of the ziwi locus. Colored boxes represent exons. +1 indicates the predicted transcription start site. The location of the PCR primers used to amplify this region are shown as arrows. B: The structural organization of the Tg(ziwi:EGFP) transgene construct. C-L show germ cell-specific expression at various developmental stages. C: Seven days post-fertilization (dpf) larva (arrow indicates EGFP+ gonocytes; position of swim bladder is outlined). D: Twenty-five-dpf larvae (arrow shows EGFP+ of gonad). E-G: Forty-dpf ovaries (pre-meiotic germ cells outlined; arrows point to metaphase-stage mitotic EGFP+ germ cells). H-J: Two-month-old testes (spermatogonia outlined in I and J). K: Four-month-old ovary (outlined; arrow points to germinal zone). L:EGFP+ spermatozoa. EGFP expression is in green (C-F, H, I, K, and L) and DNA staining is in blue (E, F, H, I, and L). G and J show DNA only channel from F and I, respectively. sb, swim bladder; st, stomach; IA and IB indicate oocyte stages. Scale bars = 40 μm in E, H; 20 μm in F, I, and L; 200 μm in K. |
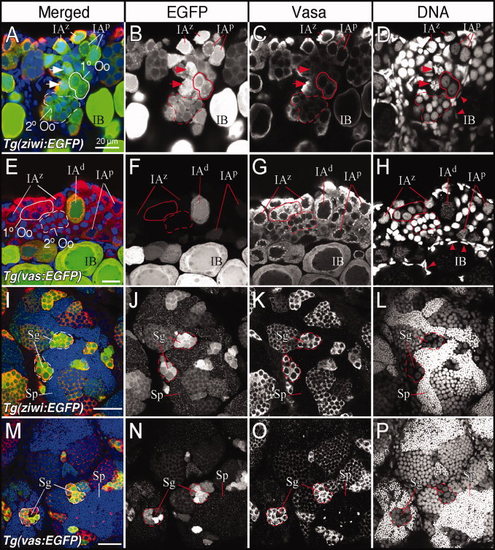
Tg(ziwi:EGFP), but not Tg(vas:EGFP), is expressed in all early-stage germ cells. Comparison of Vasa protein and Tg(ziwi:EGFP) expression (A-D and I-L) and Tg(vas:EGFP) expression (E-H and M-P) in ovaries (A-H) and testes (I-P). Merged panels (A, E, I, M) show Vasa (red), EGFP (green), and DNA (blue). B, F, J, and N show EGFP only. C, G, K, and O show Vasa only. D, H, L, and P show DNA only. In A–H, primary and secondary oogonia are outlined in solid and dashed lined, respectively. Arrows in A–D indicate mitotic germ cells, and arrowheads in D and H indicate follicle cell nuclei. Oo for oogonia; IAz, IAp, and IAd for zygotene-, pachytene-, and diplotene stage-IA oocytes, respectively; IB, stage IB oocyte; sg, spermatogonia; sp, spermatozoa. Scale bars = 20 μm in A and E; 40 μm in I and M. EXPRESSION / LABELING:
|

Unillustrated author statements EXPRESSION / LABELING:
|