
|
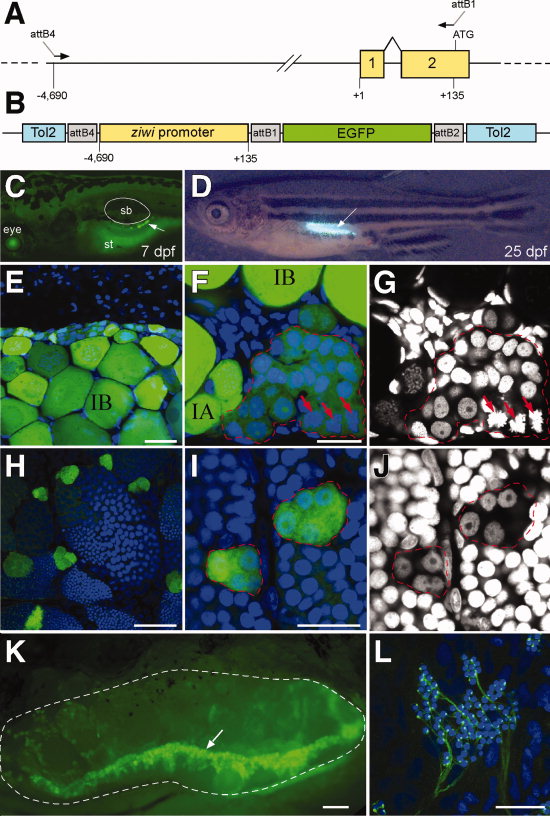
Fig. 1 Identification of the ziwi promoter. A: The structure of the 52 region of the ziwi locus. Colored boxes represent exons. +1 indicates the predicted transcription start site. The location of the PCR primers used to amplify this region are shown as arrows. B: The structural organization of the Tg(ziwi:EGFP) transgene construct. C-L show germ cell-specific expression at various developmental stages. C: Seven days post-fertilization (dpf) larva (arrow indicates EGFP+ gonocytes; position of swim bladder is outlined). D: Twenty-five-dpf larvae (arrow shows EGFP+ of gonad). E-G: Forty-dpf ovaries (pre-meiotic germ cells outlined; arrows point to metaphase-stage mitotic EGFP+ germ cells). H-J: Two-month-old testes (spermatogonia outlined in I and J). K: Four-month-old ovary (outlined; arrow points to germinal zone). L:EGFP+ spermatozoa. EGFP expression is in green (C-F, H, I, K, and L) and DNA staining is in blue (E, F, H, I, and L). G and J show DNA only channel from F and I, respectively. sb, swim bladder; st, stomach; IA and IB indicate oocyte stages. Scale bars = 40 μm in E, H; 20 μm in F, I, and L; 200 μm in K.