
|
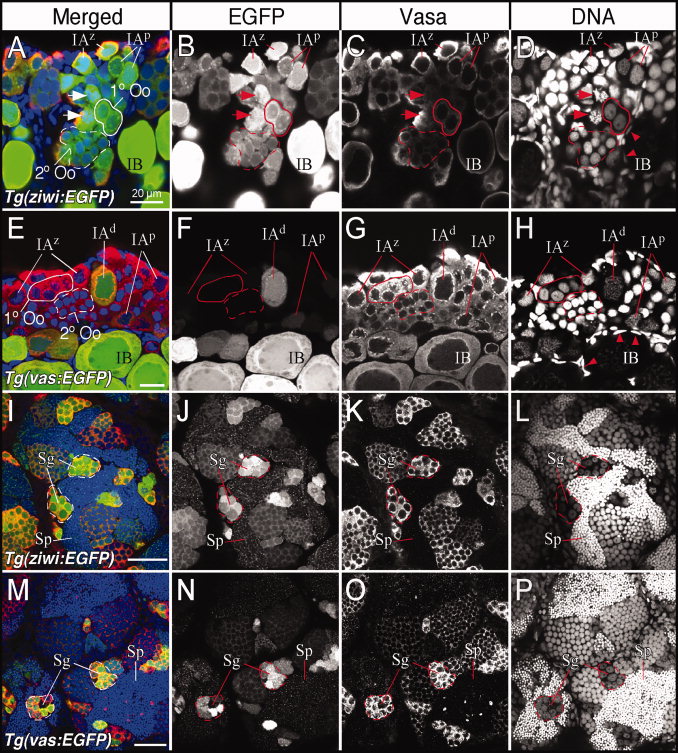
Fig. 2 Tg(ziwi:EGFP), but not Tg(vas:EGFP), is expressed in all early-stage germ cells. Comparison of Vasa protein and Tg(ziwi:EGFP) expression (A-D and I-L) and Tg(vas:EGFP) expression (E-H and M-P) in ovaries (A-H) and testes (I-P). Merged panels (A, E, I, M) show Vasa (red), EGFP (green), and DNA (blue). B, F, J, and N show EGFP only. C, G, K, and O show Vasa only. D, H, L, and P show DNA only. In A–H, primary and secondary oogonia are outlined in solid and dashed lined, respectively. Arrows in A–D indicate mitotic germ cells, and arrowheads in D and H indicate follicle cell nuclei. Oo for oogonia; IAz, IAp, and IAd for zygotene-, pachytene-, and diplotene stage-IA oocytes, respectively; IB, stage IB oocyte; sg, spermatogonia; sp, spermatozoa. Scale bars = 20 μm in A and E; 40 μm in I and M.