
- Title
-
Nrk2b-mediated NAD+ production regulates cell adhesion and is required for muscle morphogenesis in vivo: Nrk2b and NAD+ in muscle morphogenesis
- Authors
- Goody, M.F., Kelly, M.W., Lessard, K.N., Khalil, A., and Henry, C.A.
- Source
- Full text @ Dev. Biol.
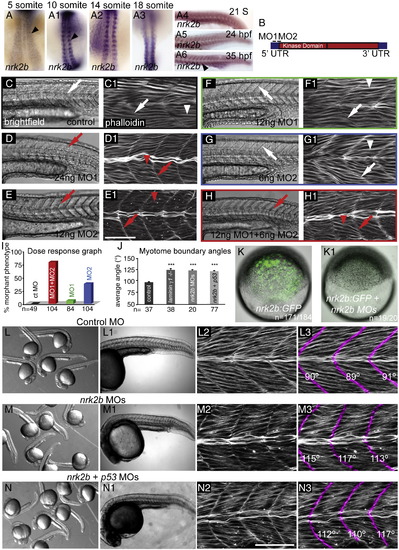
nrk2b expression and MO characterization. (A–A6) ISH with nrk2b probe. (A–A3) Dorsal mount, anterior top. (A4–A6) Side mount, anterior left, dorsal top. Black arrowheads denote nrk2b expression. (B) Cartoon of nrk2b and MO target sites. (C–H1) Side mount, anterior left, dorsal top, 26 hpf embryos, lettered panels are DIC images, numbered panels are phalloidin stained to visualize actin. (C, C1) Injection of a standard control MO did not elicit a phenotype. Myotomes are V-shaped (white arrows) and muscle fibers are normal (white arrowheads). Injection of the functional dose of MO1 (D, D1) or MO2 (E, E1) resulted in U-shaped myotomes (red arrows) and wavy muscle fibers (red arrowheads). Injection of half the functional dose of MO1 (F, F1) or MO2 (G, G1) did not disrupt muscle development. (H, H1) Injection of both low doses of MO1 + MO2 recapitulated the phenotype. (I) Dose response graph. Injection of low doses of MO1 + MO2 resulted in more embryos with the phenotype than injection of either low dose alone (n of embryos injected is listed on the x-axis). (J) Average myotome boundary angles of 26 hpf control, laminin γ1 mutants, nrk2b morphant, and nrk2b + p53 MO-injected embryos. laminin γ1 mutants, nrk2b morphants, and nrk2b + p53 morphants have myotome boundaries of a similar angle and all have myotome boundary angles that are significantly wider than controls, p < 0.001 (n of MTJs measured is listed on the x-axis). (K–K1) Brightfield images of shield stage embryos. Animal pole to the top. (K) Embryo injected with the nrk2b:gfp plasmid that contains both MO target sites. (K1) Embryo injected with the nrk2b:gfp plasmid and nrk2b MOs. Note that expression of GFP-tagged Nrk2b is drastically decreased by injection of nrk2b MOs (3 experiments, 1 representative experiment: 93% of nrk2b:gfp injected embryos expressed GFP (n = 171 out of 184 embryos) whereas only 5% of nrk2b:gfp + nrk2b MO-injected embryos expressed any GFP (n = 1 out of 20 embryos)). (L–N) Brightfield images of a dish of 26 hpf embryos. (L–L1) Control MO-injected embryos. (M–M1) nrk2b morphants. (N–N1) nrk2b + p53 morphants. (L1–N1) Side mount, anterior left, dorsal top, 26 hpf embryos, DIC imaging. Higher magnification images of one representative embryo from each of the corresponding dishes. Note that the control morphant (L1) has a longer body axis than both nrk2b morphants (M1) and nrk2b + p53 double morphants (N1). (L2–N3) Side mount, anterior left, dorsal top, 26 hpf embryos, phalloidin staining to visualize actin. Higher magnification views of embryos from the corresponding dishes. In panels numbered 3, myotome boundaries were pseudocolored fuchsia and the myotome boundary angle is given with the corresponding boundary. Note that while injection of p53 MO did rescue the cell death seen in the head of nrk2b morphants, it did not rescue the shorter body axis (compare M1 to N1) or the U-shaped myotomes (compare M3 to N3). Scale bars are 50 μm, ***p < 0.001. EXPRESSION / LABELING:
PHENOTYPE:
|
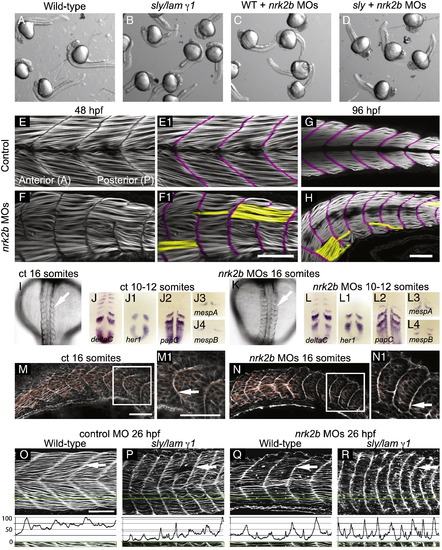
Disrupted MTJs in nrk2b morphants are not due to discontinuous initial somite boundaries. (A–D) Brightfield images of a dish of 26 hpf embryos. (A) Wild-types. (B) sly/laminin γ1 mutants. (C) nrk2b morphants. (D) nrk2b MO-injected-laminin γ1 mutants. Note that injection of nrk2b MOs into laminin mutants does not drastically worsen their phenotype or result in death. (E–H) Side mount, anterior left, dorsal top, phalloidin stained embryos, MTJ boundaries are pseudocolored fuchsia and abnormally long muscle fibers are pseudocolored yellow. (E–E1) 48 hpf control. (F–F1) 48 hpf nrk2b morphant (71/212, 33% of MTJs are crossed by muscle fibers). (G) 96 hpf control. (H) 96 hpf nrk2b morphant (19/67, 28% of MTJs are crossed by muscle fibers). (I, K) Dorsal mount, anterior top, 16 S, brightfield images. Note that somite boundaries form (white arrows) in nrk2b morphants (K). (Panels J and L) Dorsal mount, anterior top, 10–12 S, ISH for known somite patterning and somite boundary formation genes. Note that the domains and patterns of expression are similar between controls (panel J) and nrk2b morphants (panel L). (M–N) Side mount, anterior left, dorsal top, 16 S, phalloidin staining. Note concentrated actin at the initial somite boundary (white arrows). These data show that discontinuous MTJs are not due to discontinuous initial somite boundaries. (O–R) Side view, anterior left, dorsal top, 26 hpf embryos, phalloidin stained to visualize actin. (O–P) Control MO-injected. (Q–R) nrk2b MO-injected. (O, Q) Wild-types. (P, R) sly/laminin γ1 mutants. Note that in laminin mutants and nrk2b morphants, actin is enriched at the MTJ (white arrows) and lacking in the myotome. Green boxes correspond to normalized fluorescence intensity (see Materials and methods) plots. These graphs support the qualitative actin disruption seen in laminin mutants and nrk2b morphants. Scale bars are 50 μm. EXPRESSION / LABELING:
PHENOTYPE:
|
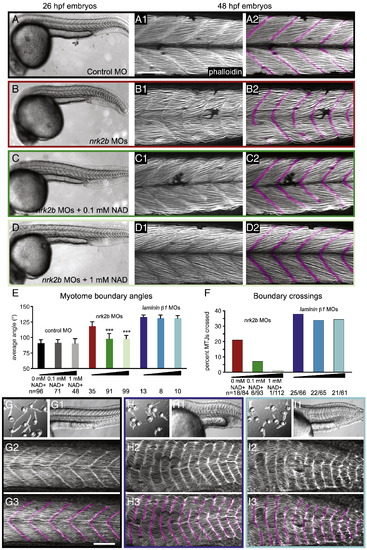
Exogenous NAD+ treatment rescues the nrk2b morphant muscle phenotype. (A–D) Brightfield images, side mount, anterior left, dorsal top, 26 hpf embryos. (Numbered panels A–D) Side mount, anterior left, dorsal top, 48 hpf embryos, phalloidin stained to visualize actin. In panels numbered 2, MTJs are pseudocolored fuchsia. (Panel A) Control MO-injected. (Panel B) nrk2b MO-injected. (Panel C) nrk2b MO-injected embryos incubated in 0.1 mM NAD+. (Panel D) nrk2b MO-injected embryos incubated in 1 mM NAD+. (E) Graph of average myotome boundary angles in controls, NAD+-treated controls, nrk2b morphants, NAD+-treated nrk2b morphants, laminin morphants, and NAD+-treated laminin morphants. The average myotome boundary angle of nrk2b morphants is significantly different than controls (Student t-test, p < 0.001) and the average myotome boundary angle of NAD+-treated nrk2b morphants is significantly different than untreated nrk2b morphants and controls (Student t-test, p < 0.001, n of myotome boundaries measured on x-axis). (F) Graph of the percent of MTJs crossed by muscle fibers in nrk2b morphants, NAD+-treated nrk2b morphants, laminin morphants, and NAD+-treated laminin morphants. NAD+ treatment rescues boundary crossings in a dose dependent manner in nrk2b morphants, but not laminin morphants (n of MTJs crossed over total MTJs analyzed is listed on the x-axis). (Panel G) Controls. (Panel H) laminin morphants. (Panel I) 1 mM NAD+-treated laminin morphants. (Lettered panels) Brightfield images of a dish of embryos. (Panels numbered 1) Side mount, brightfield images, 26 hpf embryos, anterior left, dorsal top. (Panels numbered 2) Side mount, 48 hpf embryos, anterior left, dorsal top, phalloidin stained to visualize actin. (Panels numbered 3) MTJs are pseudocolored fuchsia. Scale bars are 50 μm, ***p < 0.001. |
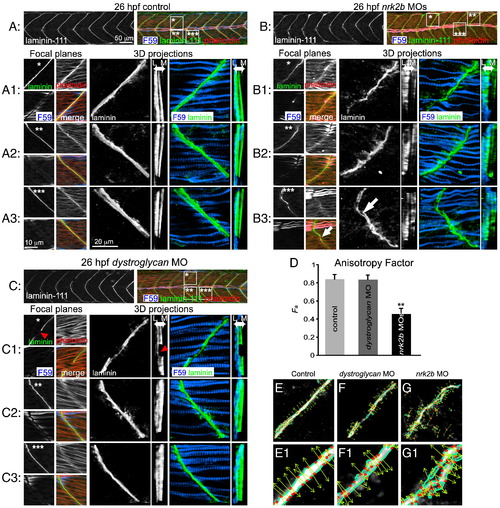
Nrk2b is required for normal basement membrane development. (A, B, C) 26 hpf embryos, side mount, anterior left, dorsal top, F59 antibody stained to visualize slow-twitch muscle, phalloidin stained to visualize actin and Laminin-111 antibody stained to visualize the basement membrane of the MTJ. Also see Supplementary movies. (A) Control. (B) nrk2b morphant. (C) dystroglycan morphant. Numbered panels 1–3 are examples of different MTJs within an embryo from each treatment (*, ** or *** indicates the location of the MTJ). Small square panels are focal planes of each antibody/stain used as well as a merged view. Large square panels are 3D reconstructed Laminin-111 antibody staining (in black and white) or F59 and Laminin-111 antibody staining (in color). Tall rectangular panels are transverse views of the 3D reconstructed antibody staining with lateral to the left and medial to the right. Note in the MTJ examples in nrk2b morphants (panel B) that Laminin-111 is not laid down in a straight line and is not always continuous (white arrows). In the transverse views, note that Laminin-111 is especially disrupted in the medial fast-twitch fiber domain. In dystroglycan morphants, MTJs can still be discontinuous (red arrowheads), but Laminin-111 is robust in the lateral and medial domains. (D) Graph of the anisotrophy factor (see Materials and methods) in Laminin-111 stained images. A lower anisotrophy value in nrk2b morphant images indicates that there is less order/structure in Laminin-111 staining in these morphants. (E–G) Side mount, anterior left, dorsal top, 26 hpf embryos, Laminin-111 antibody staining. Numbered panels are higher magnification views of corresponding panels. Images were analyzed with the 2D Wavelet Transform Modulus Maxima (2DWTMM) method. (Panel E) Controls. (Panel F) dystroglycan morphants. (Panel G) nrk2b morphants. In controls and dystroglycan morphants, the vectors are more parallel indicating more order than in nrk2b morphants. Scale bars are labeled on the figure, **p < 0.01. PHENOTYPE:
|
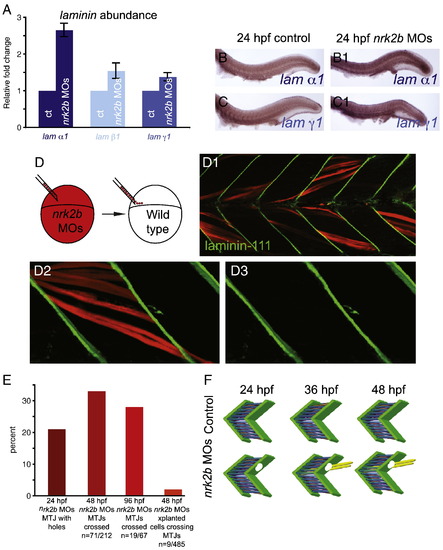
Nrk2b is non-cell autonomously required for normal basement membrane polymerization. (A) qRT-PCR for relative transcript abundance of the three laminin chains that comprise Laminin-111 in 24 hpf embryos. (B–C) Side mount, anterior left, dorsal top, 24 hpf. ISH for laminin transcripts in controls (lettered panels) and nrk2b morphants (numbered panels), (panel B) laminin α1, (panel C) laminin γ1. ISH and qRT-PCR suggest that Laminin-111 defects in nrk2b morphants are not due to a laminin transcription deficiency. (D) Model of dextran labeled nrk2b morphant cells being transplanted into a wild-type host at blastula stage. (D1–D3) Side mount, anterior left, dorsal top, 48 hpf, red cells are dextran labeled Nrk2b-deficient cells. Laminin-111 antibody staining (in green) is normal adjacent to Nrk2b-deficient cells (red) in a wild-type background. This suggests that basement membrane polymerization is a phenomenon mediated by communities of cells and that Nrk2b is non-cell autonomously required for basement membrane polymerization. (E) Graph of the percentage of MTJs with holes in Laminin-111 or with boundary crossings over time. The observation that the percentage of MTJs with defects does not steadily increase over time suggests that boundary crossings are not due to age-dependent degeneration of the MTJ. Note that a very small percentage of Nrk2b-deficient cells cross MTJs in wild-type hosts suggesting that these cells do not actively degrade Laminin-111 and that Nrk2b functions non-cell autonomously in basement membrane development. (F) Model of MTJ basement membrane defects in nrk2b morphants leading to fibers crossing MTJs as time progresses. |
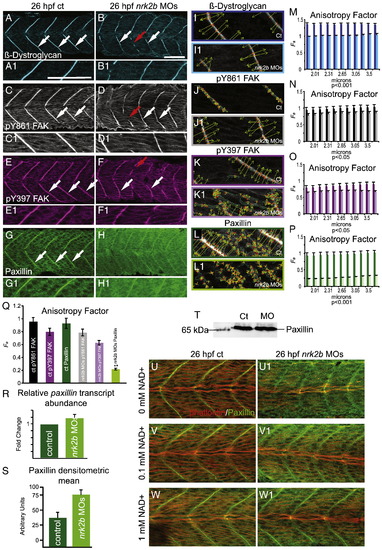
Nrk2b is required for normal subcellular localization of Paxillin, but not β-Dystroglycan or FAK. (A–H) Side mount, anterior left, dorsal top, 26 hpf. Panels A, C, E, and G are controls. Panels B, D, F, and H are nrk2b morphants. Panels numbered 1 are magnifications of the corresponding lettered panels. (A–B1) β-Dystroglycan antibody staining. (C–D1) pY861 FAK antibody staining. (E–F1) pY397 FAK antibody staining. (G–H1) Paxillin antibody staining. White arrows indicate normal localization of proteins to MTJs. Red arrows in nrk2b morphants (B, D, F) indicate discontinuous MTJs crossed by muscle fibers. Note that in nrk2b morphants (H, H1), Paxillin does not robustly concentrate to MTJs. (I–L) Side mount, anterior left, dorsal top, 26 hpf controls (lettered panels) and nrk2b morphants (numbered panels). Application of 2D WTMM method showing maxima chains (dark green), nodes (red), and vectors (light green) for CMAC component antibody staining. (M–Q) Graphs of anisotropy or the amount of order in a structure over a range of applicable size scales. (R) qRT-PCR, (S) average densitometric mean of Paxillin antibody-stained images and (T) Western analysis suggest that Paxillin levels are not decreased in nrk2b morphants. (U–W) Side mount, anterior left, dorsal top, 26 hpf embryos, phalloidin staining in red, Paxillin antibody staining in green. Lettered panels are controls and numbered panels are nrk2b morphants. (Panel U) No exogenous NAD+. (Panel V) 0.1 mM exogenous NAD+. (Panel W) 1 mM exogenous NAD+. Note that exogenous NAD+ treatment rescues medial Paxillin concentration at the MTJ in nrk2b morphants in a dose dependent manner. Scale bars are 50 μm. |
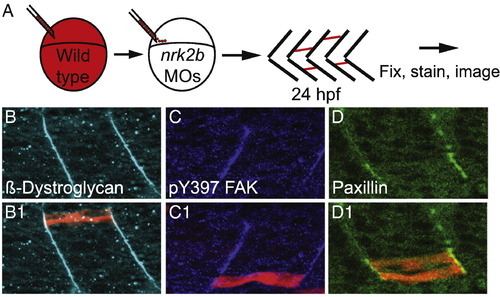
Nrk2b is cell autonomously required for Paxillin localization to MTJs. (A) Cartoon showing dextran labeled wild-type cells being transplanted into a nrk2b morphant host at blastula stage. (B–D) Side mount, anterior left, 26 hpf nrk2b morphant hosts with transplanted wild-type cells (red), β-Dystroglycan antibody staining (light blue, panel B), pY397 FAK antibody staining (dark blue, panel C), and Paxillin antibody staining (green, panel D). Note that β-Dystroglycan and pY397 FAK robustly localize to MTJs in nrk2b morphants in the presence and the absence of transplanted wild-type cells. Note that robust Paxillin localization to the MTJ in nrk2b morphants is rescued in the transplanted wild-type cells, but not in the Nrk2b-deficient cells surrounding them. |
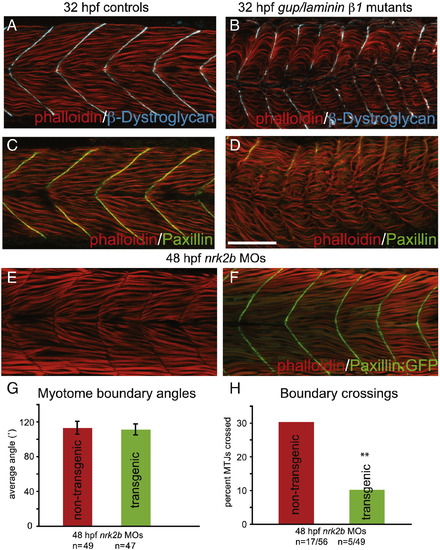
Paxillin overexpression rescues MTJ integrity in nrk2b morphants. (A–D) Side mount, anterior left, dorsal top, 32 hpf controls (panels A and C) gup/laminin β1 mutants (panels B and D) stained with phalloidin (red), β-Dystroglycan (blue) and Paxillin (green). Note that the Paxillin is severely disrupted in gup/laminin β1 mutants, suggesting that adhesion to Laminin plays a role in Paxillin localization. (E–F) Side mount, anterior left, dorsal top, 48 hpf embryos. (E) nrk2b morphant. Note that approximately 1/3 of MTJs are crossed by muscle fibers. (F) nrk2b-MO-injected Paxillin:GFP transgenic zebrafish. Note that overexpression of Paxillin:GFP greatly reduces the frequency of boundary crossings in nrk2b morphants. (G) Graph of myotome boundary angles. Note that overexpression of Paxillin:GFP does not rescue the wider myotome boundary angles observed in nrk2b morphants (n of myotome boundary angles measured is on the x-axis). (H) Graph of percentage of MTJs crossed by muscle fibers. Note that overexpression of Paxillin:GFP does significantly rescue boundary crossings in nrk2b morphants (n of crossed MTJs over total MTJs analyzed is on the x-axis). Scale bar is 50 μm, **p < 0.01. |
Reprinted from Developmental Biology, 344(2), Goody, M.F., Kelly, M.W., Lessard, K.N., Khalil, A., and Henry, C.A., Nrk2b-mediated NAD+ production regulates cell adhesion and is required for muscle morphogenesis in vivo: Nrk2b and NAD+ in muscle morphogenesis, 809-826, Copyright (2010) with permission from Elsevier. Full text @ Dev. Biol.