
- Title
-
Regulation of slow and fast muscle myofibrillogenesis by Wnt/beta-catenin and myostatin signaling
- Authors
- Tee, J.M., van Rooijen, C., Boonen, R., and Zivkovic, D.
- Source
- Full text @ PLoS One
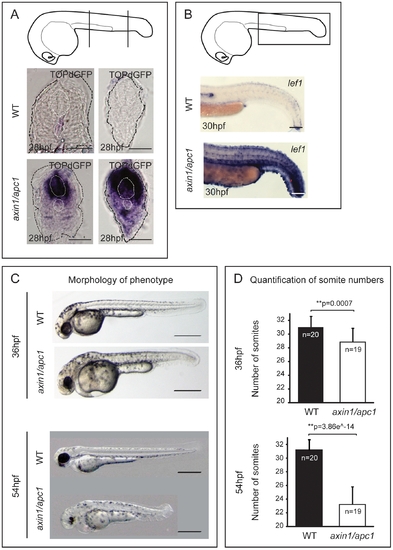
Hyperactivation of Wnt/β-catenin pathway leads to late somite-loss. (A) TOPdGFP transgenic embryos report activated Wnt/β-catenin signaling, i.e. TOPdGFP transcripts. Cartoon depicts the level of vibratome sectioning i.e. left panel at the yolk extension and right panel caudal to the yolk extension. Scale bar, 50 μm. (B) Hyperactivation of a target of Wnt/β-catenin pathway lef1, as shown with WISH, in axin1/apc1 mutants matches the expression of TOPdGFP. Scale bar, 250 μm. (C) The axin1/apc1 embryos are slightly shorter compared to wild-type embryos at 36 hpf, top panels. At 54 hpf, the difference becomes striking, bottom panels. Scale bar, 500 μm. (D) Somite counts at 36 hpf and 54 hpf, corresponding to embryos depicted in (C) with error bars showing the standard deviation. |

Late hyperactivation of Wnt/β-catenin pathway leads to aberrant myofibrillogenesis. (A) axin/apc1 embryos at 36 hpf have thickened slow muscle fibers, left panels. The fast muscle fibers at 36 hpf are detached from the vertical myoseptum, forming lesions (white arrow heads) and are disorganized, middle panels. At 54 hpf, fast muscle fibers are thickened (hypertrophic), right panels. All embryos were imaged at the positions as depicted in cartoons. Images for F59 and Eb165 at 36 hpf are cumulative z-stacks. Images for Phalloidin at 54 hpf are single z-plane at the level of fast muscle fibers. Scale bar, 25 μm. (B) Quantitative real-time PCR (qRT-PCR) of myhz2 (fast muscle specific) and myhz5 (slow muscle specific) mRNA expression normalized to actin. Graphs show that the quantity of myhz5 is not significantly different in axin1/apc1 embryos, failing to identify subtle difference as shown in Fig. 2A. The quantity of myhz2 is upregulated in axin1/apc1 embryos at 54 hpf. (C) LiCl treatment during various time intervals. Early treatment = tailbud stage and 16 hpf for 40 minutes each on the same clutch of embryos, mid treatment = at 16 hpf and 24 hpf and late treatment = at 24 hpf and 30 hpf. Embryos were stained with Phalloidin for visualization of all muscle fibers. All embryos were imaged at the level of the yolk extension, as depicted in cartoon. Images are cumulative z-stacks. Scale bar, 25 μm. |

Apoptosis at somite boundaries and muscle fibers. (A) From 36 hpf onwards, axin1/apc1 embryos show an increase in apoptosis as labeled by TUNEL. Insets show the imaged area. Scale bar, 100 μm. Apoptotic cells labeled with acridine orange lining up at the somites boundaries, right panel. Arrows and lines mark the somite boundaries. Scale bar, 25 μm. (B) TUNEL labeling at 54 hpf show an increase in apoptotic cells in the myotome. Cartoon depicts the level of sectioning i.e. left panel at the posterior end of the yolk extension and right panel posterior end of the tail. NT-neural tube; M-myotome. (C) Co-labeling of fluorescent TUNEL assay (apoptotic cells) and phalloidin labeling (muscle fibers), left and middle panel. This CLSM image was taken caudal to the yolk extension, at a single z-plane of 5 μm of fast muscle fibers. |
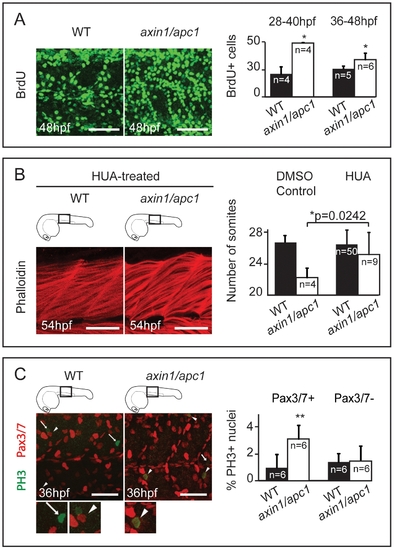
Myotome hyperproliferation and sustained differentiation in axin/apc1 embryos. (A) BrdU pulse was performed at 36 hpf, chased for 12 hours, and imaged at 48 hpf. Embryos were imaged at the level of the yolk extension. Scale bar, 25 μm. BrdU+ pulse was performed at 28 hpf or 36 hpf, and quantification of number of BrdU+ proliferating cells per somite was done 12 hours later at 40 hpf or 48 hpf, respectively. (C) HUA treatment of embryos from 24 hpf until fixation at 54 hpf. Inhibition of proliferation with HUA from 24 hpf results in rescue of muscle hypertrophy. Muscle fibers were stained with Phalloidin, and imaged at 54 hpf at the level of the yolk extension. Compare with untreated wild-types in Fig. 2A (right panels). Scale bar, 25 μm. Quantification of number of somites is increased in axin1/apc1 mutants upon HUA treatment. (E) Colocalization of Pax3/7+ and PH 3+ cells shows proliferating muscle progenitors. Quantification of proliferating Pax3/7+ and Pax3/7- cells in the wild-types vs. axin1/apc1 mutant embryos shows significantly more proliferating Pax3/7+ cells in the mutants. Scale bar, 50 μm. PHENOTYPE:
|
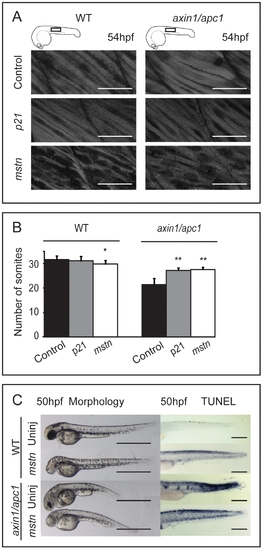
Misexpression of mstn rescues axin1/apc1 embryos. (A) Injection of 5 pg p21CIP/WAF or mstn mRNA into 1 cell stage embryos, and phenotype assessment at 54 hpf. Slightly hypotrophic muscle fibers are observed in p21 as well as mstn-injected wild-type embryos confirming efficiency of misexpression. Muscle hypertrophy in mstn-injected axin1/apc1 embryos is partially restored to normal. (B) Quantification of the somite number of uninjected and p21CIP/WAF or mstn mRNA (5 pg) injected embryos. (C) Misexpression of mstn partially restores the truncated somite phenotype, as well as cell survival in axin1/apc1. Scale bar, 0.5 mm. PHENOTYPE:
|

Mstn is dominant over Wnt/β-catenin in myofibrillogenesis. Representative images of injection of 5 ng (n = 30) or 10 ng (n = 30) Mstn MO results in muscle hypertrophy, whereas injection of 2 ng Lef1 MO (n = 30) results in hypotrophic muscle fibers. Co-injection of 10 ng Mstn MO with 2 ng Lef1 MO (n = 10) results in hypertrophic muscle fibers. Images of all embryos are cumulative z-stacks and taken at the level of the yolk extension, as depicted in cartoons. Scale bar, 50 μm. |
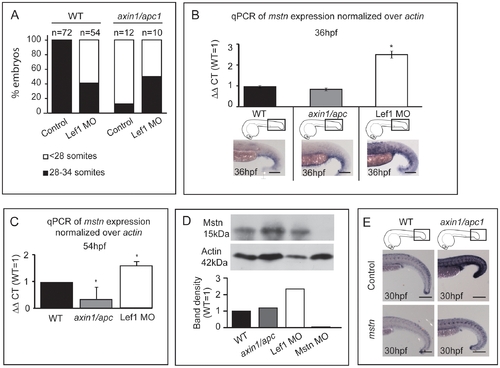
mstn is upregulated in LOF Wnt/β-catenin. (A) 2 ng Lef1 MO was injected at 1-cell stage into wild-type or axin1/apc1 embryos, and the number of somites was counted at 54 hpf. Two independent clutches of axin1/apc1 heterozygous incross were analyzed (Total n = 64), in which 10 were genotyped as axin1/apc1 homozygous. (B) Quantitative real-time PCR (qRT-PCR) of myostatin mRNA expression normalized to actin. Total RNA was isolated from 36 hpf wild-type, axin1/apc1 and Lef1 morphant embryos. Graphs show that expression of mstn is upregulated in Lef1 morphants, corresponding to the in situ hybridization with mstn probe in bottom panels. Scale bar, 100 μm. (C) Quantitative real-time PCR (qRT-PCR) of myostatin mRNA expression normalized to actin. Total RNA was isolated from 54 hpf wild-type, axin1/apc1 and Lef1 morphant embryos. Graphs show that expression of mstn is downregulated in axin1/apc1 embryos and upregulated in Lef1 morphants (D) Western blot on lysates collected from 54 hpf wild-type, axin1/apc1 and Lef1 morphant embryos. Graph shows upregulation of Mstn in Lef1 morphants. However, there is no significant difference in levels of Mstn protein in axin1/apc1 embryos versus wildtypes. (E) Misexpression of mstn mRNA downregulates the Wnt target gene lef1 in axin1/apc1 mutants shown with WISH for lef1 riboprobe. Scale bar, 100 μm. |

Normal somite formation at 24hpf, prior to secondary myofibrillogenesis. (A) Number of somites, length, as well as size of somites is not altered in axin1/apc1 embryos at 24hpf. Scale bar, 50μm. |

(A) Inhibition of proliferation with HUA resulted in decrease in apoptotic cells in axin1/apc1 embryos. The increase in apoptosis in HUA-treated wild-type embryos, as shown with TUNEL assay, suggests that proliferation has to be tightly regulated. (B) Sustained expression of MyoD+ muscle precursors at 36 hpf, as shown with WISH. Scale bar, 100 μm. (C) Sustained expression of Myogenin+ terminally differentiating cells at 25 hpf, as shown with WISH. Scale bar, 100 μm. (D) Increase in MyoD+ myoblasts at 36hpf, as shown with immunolabelling with anti-MyoD. |