
- Title
-
High resolution fate map of the zebrafish diencephalon
- Authors
- Russek-Blum, N., Nabel-Rosen, H., and Levkowitz, G.
- Source
- Full text @ Dev. Dyn.

Two-photon microscopy enables controlled photoactivation of the caged lineage tracer. A,B: Top and lateral (three-dimensional reconstruction) views of two representative labeled clones demonstrating photoactivation resulting in low- (A) and high- (B) fluorescence intensity. Note the correlation between fluorescence intensity and the thickness of the respective labeled clone. C: Mean fluorescence intensity of the uncaged domain as a function of relative laser power. Fluorescence intensity of the “caged&rdquo area was subtracted from the “uncaged” domain. Relative laser power is presented as percentage of the acousto-optic modulator (AOM) transmission under constant conditions (20 iterations; scan speed of 25.6 μsec/ pixel). The linear trend line shows a correlation coefficient of R2 = 0.9991. D: Z-axis clone span (μm) as a function of relative laser power (R2 = 0.9859). E: Z-axis clone span (μm) as a function of mean fluorescence intensity of the uncaged domain (R2 = 0.9812). a.u., arbitrary units; Scale bar = 30 μm. |
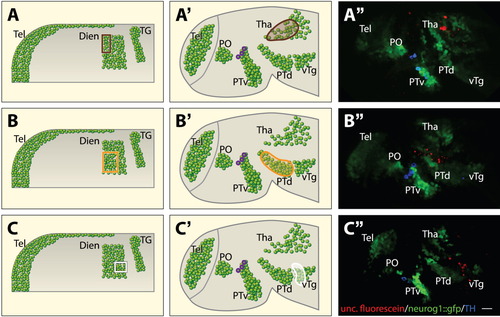
Lineage tracing of Neurog1+ cells juxtaposing the meso-diencephalic boundary. A-C: Schematic representation of 1- to 3-somite stage neurog1::gfp embryos (anterior to the left, lateral view) that were injected with caged dextran-fluorescein at one-cell stage. The tracer dye was uncaged at the anterior dorsal (A; n = 3), anterior ventral (B; n = 5), and posterior ventral (C; n = 3) areas of a discrete Neurog1+ domain located at the posterior diencephalic anlage. The boundaries of each of the uncaged clones were measured in relation to the depicted Neurog1+ domains that served as live neural plate landmarks. A′-C′: Schematic representation of the fluorescein-labeled cells at the prim-5 stage (24 hours). A″-C″: Representative images of 24 hr postfertilization (hpf) embryos that underwent uncaging followed by immunofluorescence staining of the uncaged form of the fluorescein and of tyrosine hydroxylase (TH)- positive dopaminergic (DA) neurons. The fluorescein-labeled cells marked the thalamus (Tha; A″), dorsal posterior tuberculum (PTd; B″), and ventral tegmentum (vTg; C″). Neurog1+ cells (not to scale) are depicted by green spheres and dopaminergic neurons are marked in purple. Dien, diencephalon; PO, preoptic nucleus; PTv, ventral posterior tuberculum; Tel, telencephalon; TG, trigeminal ganglion. Scale bar = 25 μm. |
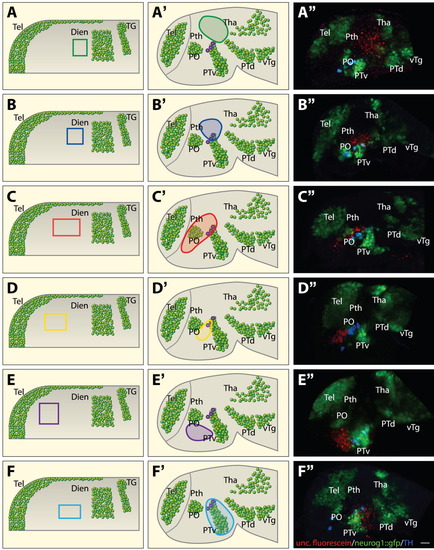
Origins of anterior diencephalic subdomains. A-F: Schematic representation of 1- to 3-somite stage neurog1::gfp embryos (anterior to the left, lateral view) that were injected with caged dextran-fluorescein at the one-cell stage. The dye was uncaged at overlapping areas located at the prospective diencephalon. The boundaries of each of the uncaged clones were measured in relation to the diencephalic Neurog1+ domain that served as a live neural plate landmark. A′-F′: Schematic representation of the fluorescein-labeled cells at the prim-5 stage (24 hours). A″-F″: Representative images of 24 hr postfertilization (hpf) embryos that underwent uncaging followed by immunofluorescence staining of the uncaged form of the fluorescein and of tyrosine hydroxylase (TH) -positive dopaminergic (DA) neurons. A: Posterior dorsal progenitor cells (15μm anterior to neurog1+ diencephalic anlage) populated the prethalamus (Pth) and thalamus (n = 3). B: Cells more anterior to those (30μm anterior to the neurog1+ diencephalic anlage) populated the dorsal tip of the ventral posterior tuberculum (PTv) including DA neurons (n = 6). C: Cells of the more anterior location (40 μm anterior to neurog1+ diencephalic anlage) gave rise to cells in the preoptic nucleus (PO) and partially overlap with the PTv DA neurons (n = 10). D: More anterior cells (90 μm anterior to neurog1+ landmark) labeled the anterior portion of the previously mapped (Russek-Blum et al.,[2008]) DA progenitor domain (n = 6). E: The most anterior neural plate clone (120 μm anterior to neurog1+ diencephalic anlage) gave rise to hypothalamic cells located between the PO and the PTv (n = 6). F: Clones located more ventrally, which their ventral border corresponded to that of the neurog1+ diencephalic anlage, gave rise to the main mass of the PTv (n = 3). Neurog1+ cells (not to scale) are depicted by green spheres and dopaminergic neurons are marked in purple. Dien, diencephalon; PTd, dorsal posterior tuberculum; Tel, telencephalon; TG, trigeminal ganglion; Tha, thalamus; vTg, ventral tegmentum. Scale bar = 25 μm. |