
|
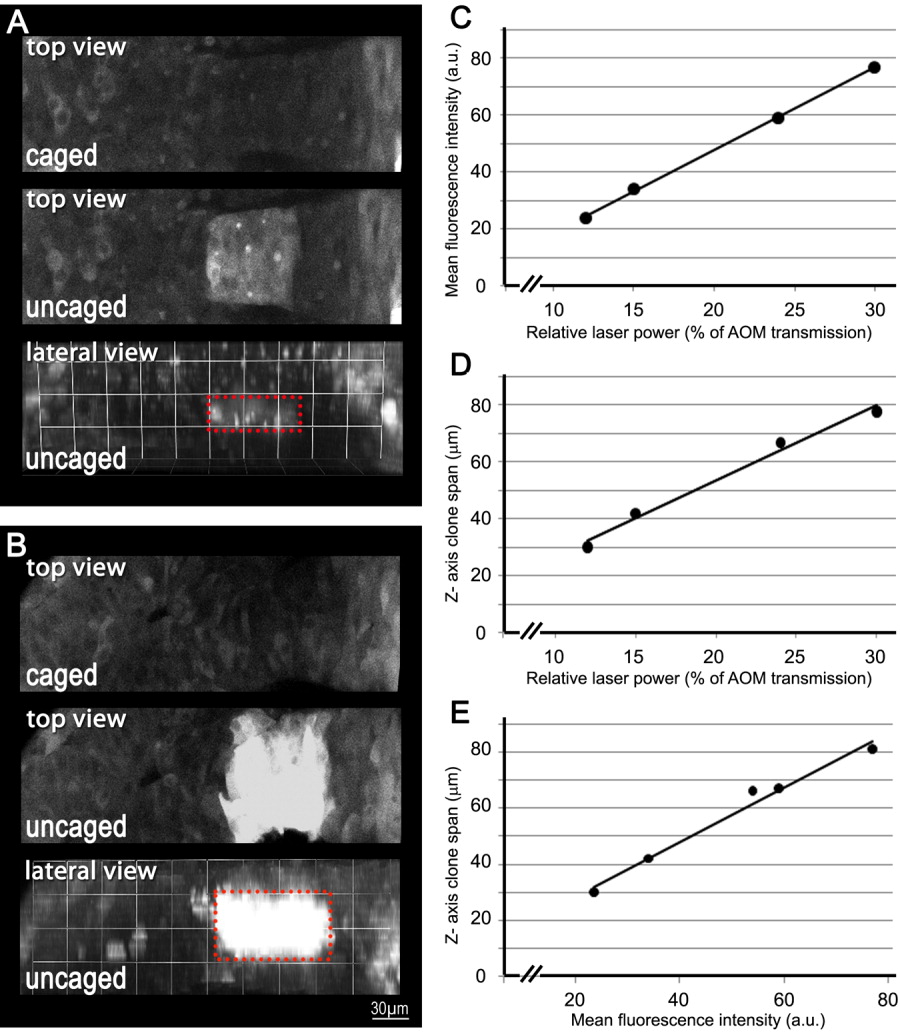
Fig. 2 Two-photon microscopy enables controlled photoactivation of the caged lineage tracer. A,B: Top and lateral (three-dimensional reconstruction) views of two representative labeled clones demonstrating photoactivation resulting in low- (A) and high- (B) fluorescence intensity. Note the correlation between fluorescence intensity and the thickness of the respective labeled clone. C: Mean fluorescence intensity of the uncaged domain as a function of relative laser power. Fluorescence intensity of the “caged&rdquo area was subtracted from the “uncaged” domain. Relative laser power is presented as percentage of the acousto-optic modulator (AOM) transmission under constant conditions (20 iterations; scan speed of 25.6 μsec/ pixel). The linear trend line shows a correlation coefficient of R2 = 0.9991. D: Z-axis clone span (μm) as a function of relative laser power (R2 = 0.9859). E: Z-axis clone span (μm) as a function of mean fluorescence intensity of the uncaged domain (R2 = 0.9812). a.u., arbitrary units; Scale bar = 30 μm.