
Fig. 4
- ID
- ZDB-FIG-090710-20
- Publication
- Russek-Blum et al., 2009 - High resolution fate map of the zebrafish diencephalon
- Other Figures
- All Figure Page
- Back to All Figure Page
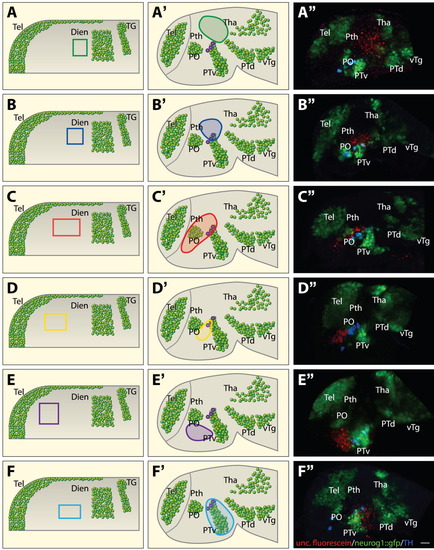
Origins of anterior diencephalic subdomains. A-F: Schematic representation of 1- to 3-somite stage neurog1::gfp embryos (anterior to the left, lateral view) that were injected with caged dextran-fluorescein at the one-cell stage. The dye was uncaged at overlapping areas located at the prospective diencephalon. The boundaries of each of the uncaged clones were measured in relation to the diencephalic Neurog1+ domain that served as a live neural plate landmark. A′-F′: Schematic representation of the fluorescein-labeled cells at the prim-5 stage (24 hours). A″-F″: Representative images of 24 hr postfertilization (hpf) embryos that underwent uncaging followed by immunofluorescence staining of the uncaged form of the fluorescein and of tyrosine hydroxylase (TH) -positive dopaminergic (DA) neurons. A: Posterior dorsal progenitor cells (15μm anterior to neurog1+ diencephalic anlage) populated the prethalamus (Pth) and thalamus (n = 3). B: Cells more anterior to those (30μm anterior to the neurog1+ diencephalic anlage) populated the dorsal tip of the ventral posterior tuberculum (PTv) including DA neurons (n = 6). C: Cells of the more anterior location (40 μm anterior to neurog1+ diencephalic anlage) gave rise to cells in the preoptic nucleus (PO) and partially overlap with the PTv DA neurons (n = 10). D: More anterior cells (90 μm anterior to neurog1+ landmark) labeled the anterior portion of the previously mapped (Russek-Blum et al.,[2008]) DA progenitor domain (n = 6). E: The most anterior neural plate clone (120 μm anterior to neurog1+ diencephalic anlage) gave rise to hypothalamic cells located between the PO and the PTv (n = 6). F: Clones located more ventrally, which their ventral border corresponded to that of the neurog1+ diencephalic anlage, gave rise to the main mass of the PTv (n = 3). Neurog1+ cells (not to scale) are depicted by green spheres and dopaminergic neurons are marked in purple. Dien, diencephalon; PTd, dorsal posterior tuberculum; Tel, telencephalon; TG, trigeminal ganglion; Tha, thalamus; vTg, ventral tegmentum. Scale bar = 25 μm. |