
- Title
-
Interactions between zebrafish pigment cells responsible for the generation of Turing patterns
- Authors
- Nakamasu, A., Takahashi, G., Kanbe, A., and Kondo, S.
- Source
- Full text @ Proc. Natl. Acad. Sci. USA
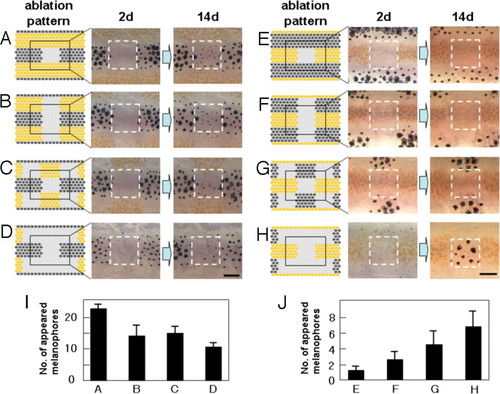
De novo pigment cell development induced by laser ablation. (A–H) To measure the influence of distant region on cell regeneration in the center region, pigment cells in the neighboring stripes were ablated by laser with the pattern shown (Left). The ablated pattern (day 2) and the regenerated pattern (day14) are shown (Center and Right). (I) The number of melanophores that appeared in the center square area for the ablation patterns a–d. (J) The number of melanophores that appeared in the center square area for the ablation patterns e–h. Pigment cells on the right side of 34-dpf fish were ablated as described (11), and the pigment cells that appeared in the center square area were recorded. Pigment cells developed in the surrounding ablated area were ablated daily to maintain the cell density of the surrounding area. n = 5 for experiment a–d, and n = 8 for e–h. SD values were presented at the top of each bar. For the details of laser ablation of the pigment cells, see ref. 11. |
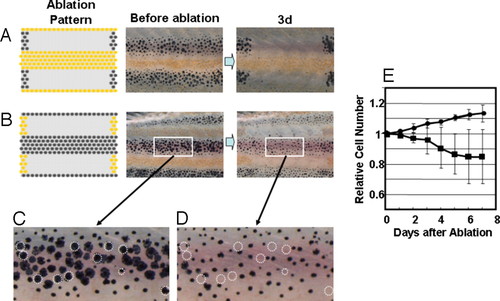
Survival of pigment cells after loss of the pigment cells in neighboring stripes. (A and B) To measure the long-range effect from the neighboring stripes to help the survival, all of the pigment cells in the neighboring stripes were ablated, and the survival of the cells in the center stripe was observed at day 3. (C and D) Magnified picture of the white square area in day 0 and day 3 of experiment B. Dotted circles are the cells that were no longer present at day 3. (E) Time course of the number of melanophores in the middle stripe region. Cell number is represented by the value relative to the original number. Black circle, number of melanophores in the control region; black square, number of the melanophores in the middle region. Pigment cells of 34-dpf fish were ablated as in Fig. 1. For all test fish, laser ablation was performed only on the left side of the trunk. The right side was used as the control. To avoid the influence of newly developed pigment cells in the ablated (yellow stripe) region, developing pigment cells were ablated daily. Number of the cells in the test region (white square) was counted and represented as value relative to the original number. SD value is represented at each point. The number of the fish used for this experiment was 8. |
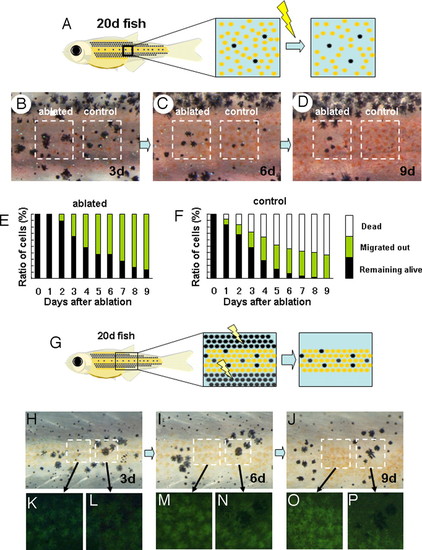
Competitive effect between adjacent pigment cells. (A) Schematic drawing of the experiment to measure the short-range effect of xanthophores on melanophore. In a 20 dpf-fish, melanophores are dispersed in the middle region where xanthophores become dominant soon after. Xanthophores adjacently surrounding each melanophore were ablated, and the survival of these cells was tracked. (B, C, and D) Survival of the melanophores in relation to the adjacent cells. In the control region, no ablations were made, and the dispersed melanophores were surrounded by xanthophores (B, right square) the number of the melanophore decreased (day 6) and disappeared at day 9. In the left square region, the xanthophores adjacently surrounding the melanophores were ablated.(B, right square) A half of melanophores survived at day 6. (E and F) Time course of melanophore survival after ablation. Survival ratio is shown as the relative value against the original number. Total number of the tested melanophores was 50 for each graph. Black bar, melanophores remained alive in the yellow stripe region; yellow bar, melanophores migrated into the black stripe region; white bar, melanophores disappeared (dead). (G) Schematic drawing of the experiment to measure the short range effect of melanophores on xanthophores. Melanophores in the black stripe region were continuously ablated to enhance the survival of melanophores in the middle region. (see Figs. 1 and 2). (H, I, and J) Survival of the pigment cells at days 3, 6, and 9 after ablation of black stripes. The region in the left square is filled with xanthophores. As the time passed, all of the xanthophores in the left region accumulated the fluorescent pigment and looked very healthy. The right square region is occupied by the mixture of melanophores and xanthophores, at day 3. As the time passed, melanophores became dominant, and the xanthophores disappeared. This should be caused by the adjacent melanophores because the xanthophore in the left region stayed alive in the same period. (K–P) Magnified picture of the outlined area in H–J. |
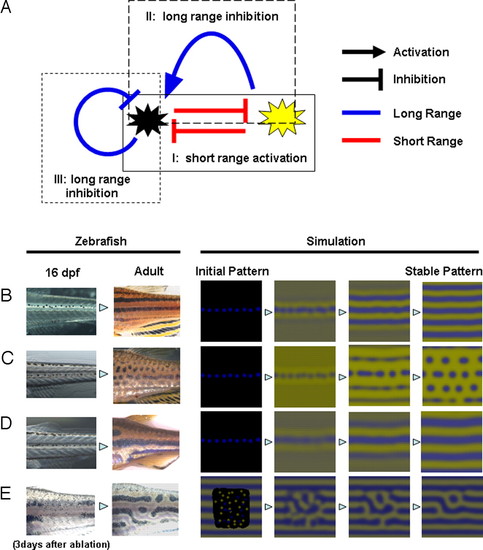
Deduced interaction network between pigment cells and simulation. (A) Control network among the pigment cells deduced by the results described in this report. There are 3 control loops that start with and return to the melanophores. Control loop I (experiment shown in Fig. 3) contains 2 short-range negative effects and functions as a short-range positive-feedback mechanism. Control loop II (experiment shown in Figs. 1 and 2) contains a negative (short) and a positive (long) effect and functions as a long-range negative-feedback mechanism. Control loop III (experiment shown in Fig. 1) is a long-range negative-feedback mechanism. As a whole network, this system satisfies the need for local activation and long-range inhibition, which have been cited by mathematical studies as necessary conditions for Turing pattern formation. (B–D) Development of pigment patterns in real zebrafish and computer simulation. In the left 2 panels, fish pigment pattern of 16-dpf and adult (3 months) are shown for wild type (B), leot1 (C), and obetc271d (D). Sixteen-dpf patterns are almost identical because the juvenile melanophore lines along the horizontal myoseptum. Therefore, we used identical initial pattern in the simulation for B, C, and D. In the right 4 panels, the results of the simulation are represented. In E, the pattern of 3 days after the ablation and regenerated pattern (11) are shown in the left 2 panels. Initial pattern for this regeneration is a random pattern in the ablated region. Details of the simulation are in Experimental Methods and Simulation. |
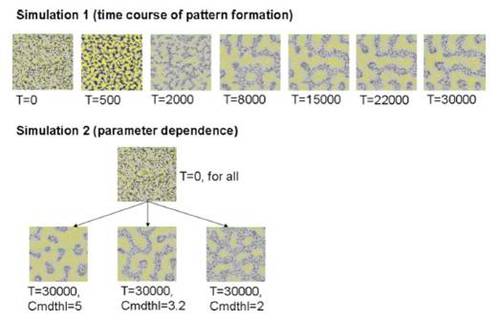
(Upper) Cell-based simulation generating a stripe (no directionality) pattern. The simulation started from the random dispersion of melanophores and xanthophores. Generated patterns at the represented (T) iteration numbers were shown. (Lower) Generation of various 2D patterns from an identical random pattern. For these simulations, one of the parameter Cmdthl that specifies the sensitivity of melanophores to the long-range factor were changed. |