
|
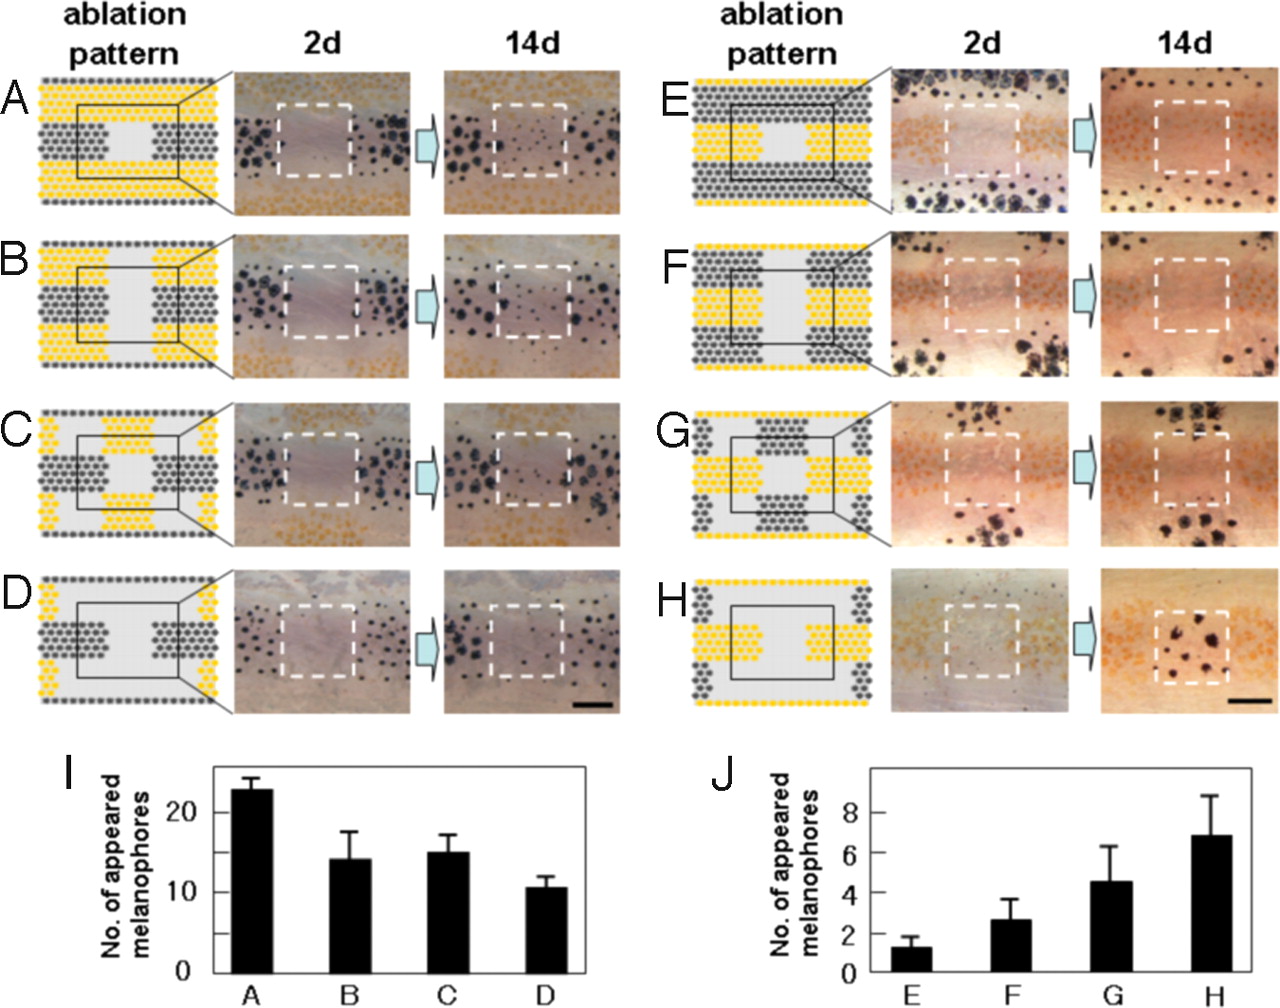
Fig. 1
De novo pigment cell development induced by laser ablation. (A–H) To measure the influence of distant region on cell regeneration in the center region, pigment cells in the neighboring stripes were ablated by laser with the pattern shown (Left). The ablated pattern (day 2) and the regenerated pattern (day14) are shown (Center and Right). (I) The number of melanophores that appeared in the center square area for the ablation patterns a–d. (J) The number of melanophores that appeared in the center square area for the ablation patterns e–h. Pigment cells on the right side of 34-dpf fish were ablated as described (11), and the pigment cells that appeared in the center square area were recorded. Pigment cells developed in the surrounding ablated area were ablated daily to maintain the cell density of the surrounding area. n = 5 for experiment a–d, and n = 8 for e–h. SD values were presented at the top of each bar. For the details of laser ablation of the pigment cells, see ref. 11.