
|
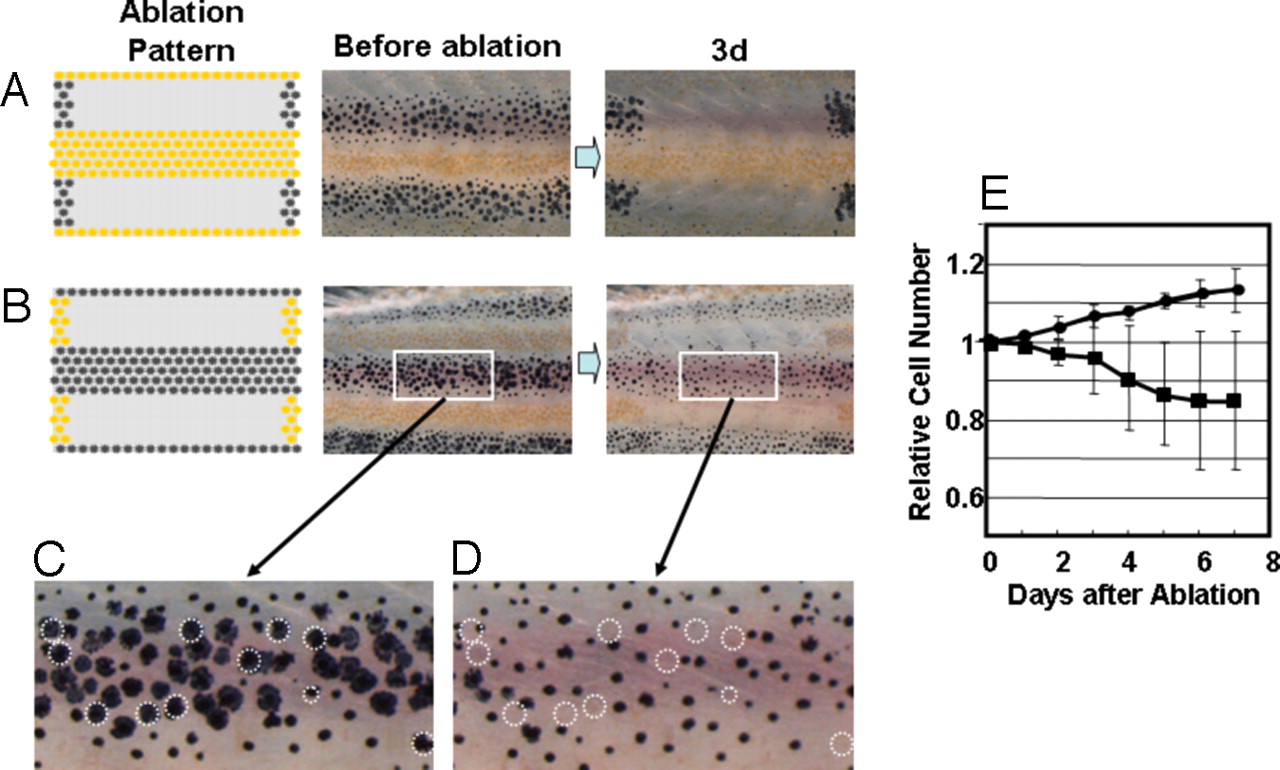
Fig. 2
Survival of pigment cells after loss of the pigment cells in neighboring stripes. (A and B) To measure the long-range effect from the neighboring stripes to help the survival, all of the pigment cells in the neighboring stripes were ablated, and the survival of the cells in the center stripe was observed at day 3. (C and D) Magnified picture of the white square area in day 0 and day 3 of experiment B. Dotted circles are the cells that were no longer present at day 3. (E) Time course of the number of melanophores in the middle stripe region. Cell number is represented by the value relative to the original number. Black circle, number of melanophores in the control region; black square, number of the melanophores in the middle region. Pigment cells of 34-dpf fish were ablated as in Fig. 1. For all test fish, laser ablation was performed only on the left side of the trunk. The right side was used as the control. To avoid the influence of newly developed pigment cells in the ablated (yellow stripe) region, developing pigment cells were ablated daily. Number of the cells in the test region (white square) was counted and represented as value relative to the original number. SD value is represented at each point. The number of the fish used for this experiment was 8.