
- Title
-
Identification and expression pattern of zebrafish prox2 during embryonic development
- Authors
- Pistocchi, A., Bartesaghi, S., Cotelli, F., and Del Giacco, L.
- Source
- Full text @ Dev. Dyn.
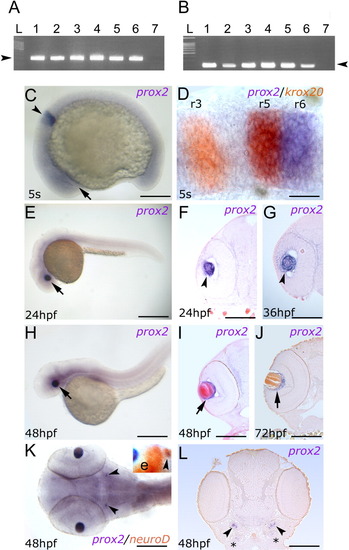
prox2 temporal and spatial expression pattern analyzed by reverse transcriptase-polymerase chain reaction (RT-PCR) and whole-mount in situ hybridization (WISH). A: RT-PCR performed on different embryonic stages: DNA ladder (L), 1-2 cells (lane 1), 50% epiboly (lane 2), tail bud (lane 3), 5-8 somites (lane 4), 24 hours post fertilization (hpf; lane 5), 48 hpf (lane 6), and negative control (lane 7) in the absence of cDNA. Arrowhead indicates the 199-bp prox2-specific seminested PCR product. B: RT-PCR performed on different adult organs: DNA ladder (L), testis (lane 1), ovary (lane 2), gills (lane 3), liver (lane 4), eye (lane 5), brain (lane 6), and negative control (lane 7) in the absence of cDNA. Arrowhead indicates the 199-bp prox2-specific seminested PCR product. C: Lateral view of a 5 somite (s) stage embryo, anterior to the left. prox2 signals appeared in the eye region (arrow) and in the hindbrain (arrowhead). D: Double staining of prox2 (blue) and krox20 (red) mRNAs at 5 s stage reveals that prox2 is expressed in the fifth and sixth rhombomeres. E,H: At 24 and 48 hpf prox2 mRNA was detectable only in the lens (arrows). F,G,I,J: Transverse sections through the forebrain of 24 and 36 hpf stage zebrafish embryos show the signal in the lens (arrowheads), while at 48 and 72 hpf, the signal is selectively retained in the layer of proliferating cells (arrows). K: The 48 hpf stage marked the onset of prox2 expression in bilateral clusters of cells located in the anterior cranial ganglia (arrowheads), as shown by the colocalization of the signal with the ganglion marker neuroD (arrowhead, inset). L: Transverse section through the forebrain of a 48 hpf stage embryo demonstrated that prox2 expression occurred in two distinct ganglia (arrowheads and asterisks). C,D,E,H: Lateral views are shown, anterior to the left. K: Dorsal view, anterior to the left. e, eye; r, rhombomeres. Scale bars = 100 μm in C, 20 μm in D, 200 μm in E,H, 50 μm in F,G,I,J,K,L. |

prox1 is not required for proper prox2 expression. (A,B,C) Lateral view. (D,E,F) Dorsal view. Anterior is left in all panels. (A) 20 s control embryo. (B) 20 s embryo injected with prox1 mRNA. (C) 20 s embryo injected with prox1MO. (D) 48 hpf control embryo. (E) 48 hpf embryo injected with prox1 mRNA. (F) 48 hpf embryo injected with prox1MO. prox2 expression was not altered in the rhombomeres (r5 and r6), anterior cranial ganglia (white arrowheads) and lens (arrows) in any of the conditions analyzed. The following abbreviations are used: r, rhombomeres; MO, morpholino oligonucleotide. Scale bars indicate 20 μm (A,B,C) and 25 μm (D,E,F). EXPRESSION / LABELING:
|

Unillustrated author statements EXPRESSION / LABELING:
|